
25M Cell Human Spatial Atlas on Latch
25M spatial atlas for human anatomy // 45 tissue types, 63 diseases and 11 spatial technologies // white-labeled spatial portals for kit providers // view large AnnData counts without a server


New capabilities are added to Latch for spatial biology:
Release of a 25 million cell spatial atlas spanning all 11 major spatial vendors: including 10X Genomics Visium, Visium HD, Xenium, Bruker Spatial CosMx, STOmics Stereo-seq, Vizgen MERSCOPE, Takara Bio Seeker, AtlasXOmics DBiT-seq, Spatial Genomics GenePS (seqFISH), Element Biosciences AVITI24, and Singular Genomics G4X.
A public data portal with annotated H5ADs ready to visualize and download
A spatial vignette to allow researchers to continue with downstream steps, such as cell type annotation, ligand-receptor analyses, or multi-sample differential gene expression
Tiled AnnData file format and visualization ecosystem to view large counts directly from a blob store without spinning up a server
Engineering biology is moving into an era of data driven and unbiased discovery. Large volumes of high quality measurements are used to tease out targets, disease mechanisms and molecular designs otherwise difficult to identify with the unaided eye.
Spatial assays provide rich information - precise molecular position and paired high resolution images - useful in modeling cell-cell interactions or emergent properties of entire tissues. These additional measurements will be necessary for AI labs to model phenomena beyond binding/structure or for data driven translational teams to mine new hypothesis space.
Scattered across the Internet are thousands of public spatial transcriptomics studies that research everything from 3D reconstruction of human embryos to tumor microenvironments for major cancer types. These datasets might help us develop a new class of therapeutics, but their potential remains locked away due to the expensive human labor required to clean and standardize them.
While there have been previous initiatives for large-scale curation, their efforts have been primarily focused on single-cell sequencing. This leaves statistical models blind to a critical dimension: spatial organization. By linking expression to physical location, we give models “eyes” to learn how cells interact with neighbors, how niches are structured, and how disease architectures emerge. This spatial context transforms fragmented molecular profiles into coherent maps of human biology, potentially opening avenues to therapeutic targets that dissociated single-cell data cannot reveal.
25M Spatial Cell Atlas for Human Anatomy
To tackle the curation challenge, the LatchBio engineering team aggregated 25M spatial transcriptomes from public human studies covering 45 tissue types, 63 diseases and 11 spatial technologies. To our knowledge, this is the largest open access sequencing based spatial atlas available to date.
The team used latch-curate, an human-in-the-loop curation framework that boosts annotation quality and consistency by incorporating information from entire papers and unstructured supplements.
A detailed whitepaper on latch-curate's design and capabilities is available at latch.bio/latch-curate.
Each dataset is published on console.latch.bio/data-portal as an annotated H5AD, structured with standardized ontologies for assay, cell type, condition, disease, tissue, patient ID (if available), and organism. Author annotations from the original paper are also included when available.
Spatial toolkit for scientists to go further
While curated datasets provide the substrate for scientific inquiry, more sophisticated downstream analyses are often required to extract knowledge and generate new hypotheses.
The Latch spatial toolkit provides scientists with step-by-step workflows to further analyze curated datasets or new studies from their own raw data.
The analysis can be broken down into 5 steps:
Counts construction from raw instrument data
Image alignment
Quality control, filtering, transformation
Multi-sample differential gene expression with pseudo-bulk analyses
Cell type annotation
Ligand-receptor analysis
Counts construction
Through partnerships with solution providers such as Takara Bio and AtlasXOmics, we build pipelines that convert raw instrument data into Scanpy-ready H5AD files. Alongside these, we generate PMtiles of morphology, H&E or IF stains, and transcript images. This collection can be loaded directly into the H5 viewer in Latch Plots for interactive exploration.
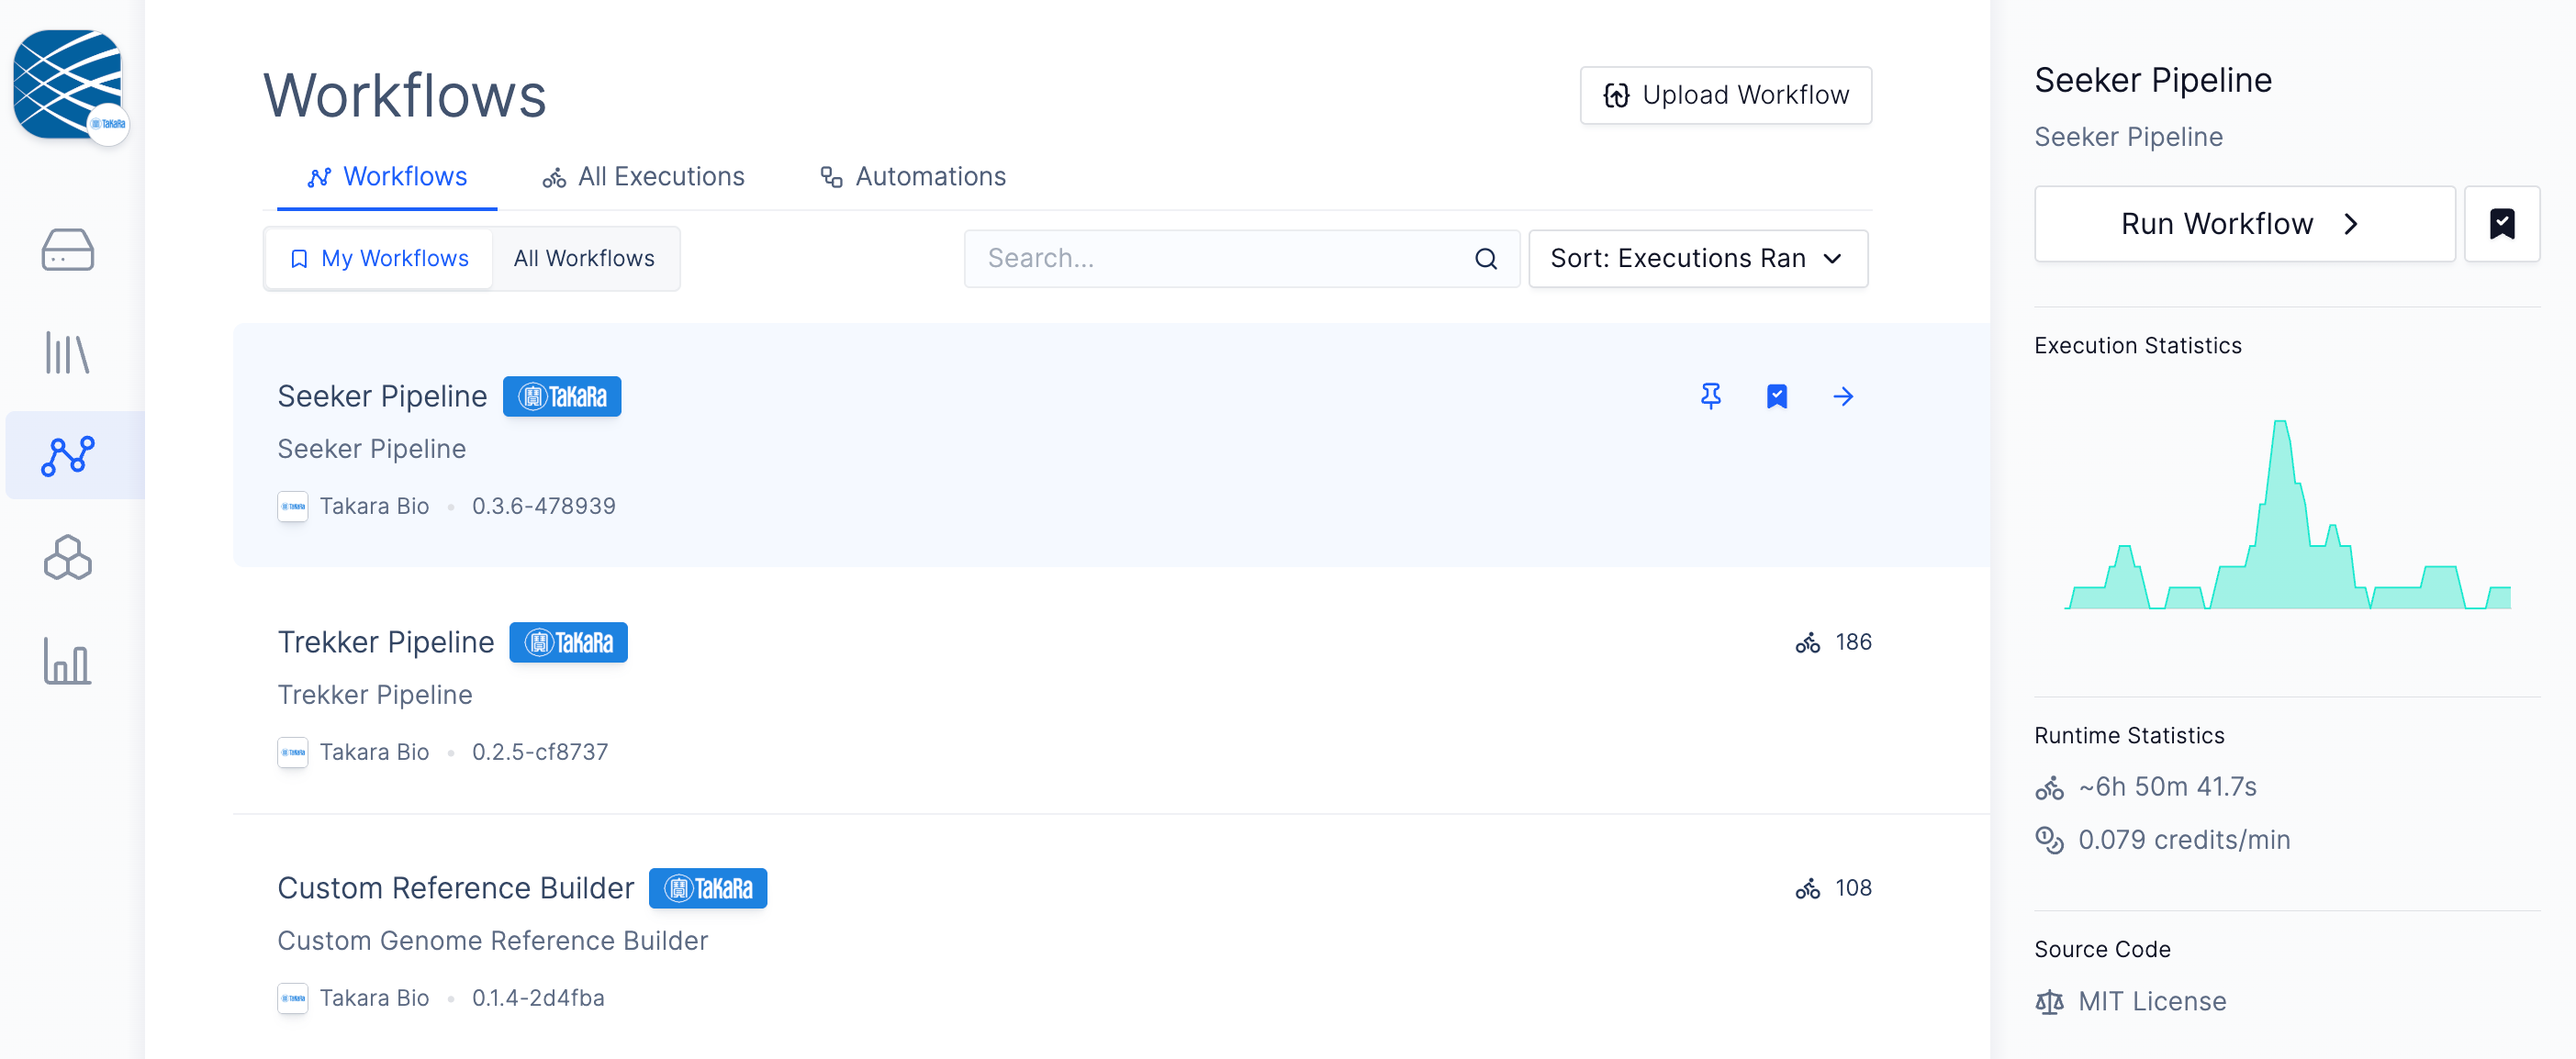
Image alignment
Spatial analysis requires precise segmentation of tissue regions. Once an H5AD is opened in the viewer, scientists can select images, define anchor points using the landmark system, and apply alignment. Both affine and STAlign modes are supported, with the latter designed for samples with severe tissue distortion.
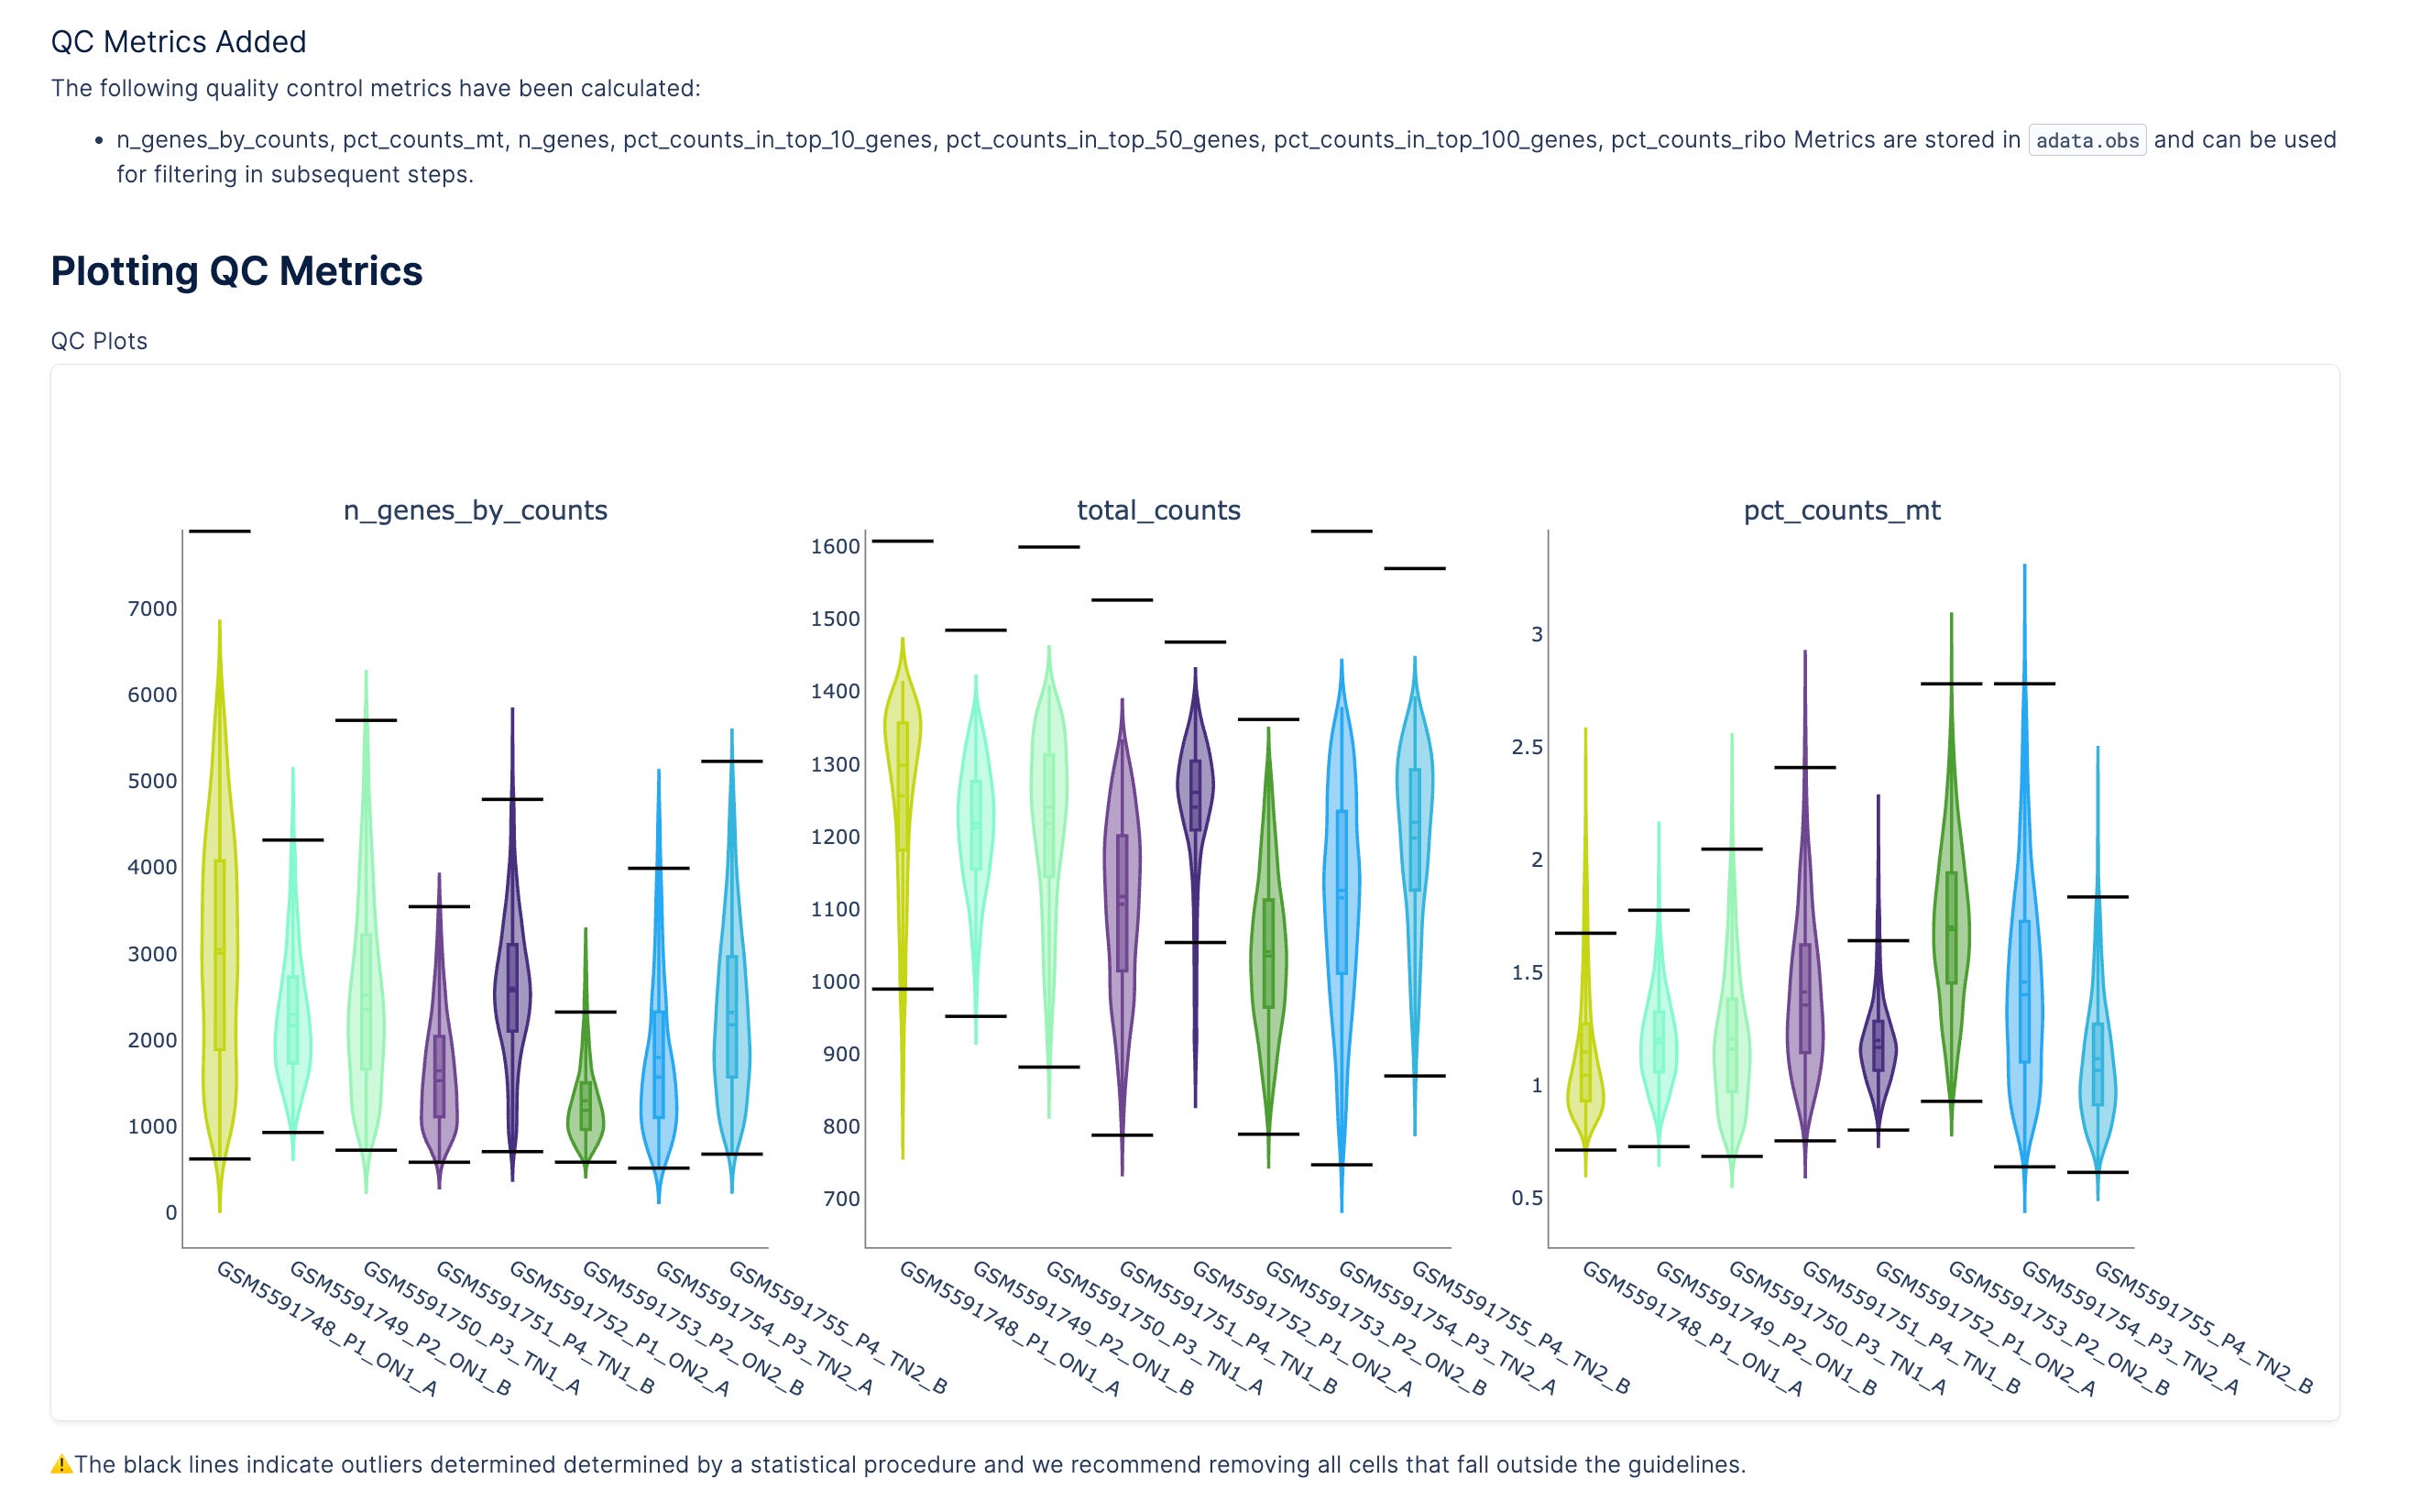
Quality control, filtering, and transformation
Within the Plot notebook, scientists can run multi-sample QC, filter cells, detect highly variable and spatially variable genes, and apply Leiden clustering to define spatial domains of interest.
Multi-sample differential gene expression with pseudo-bulk analysis
After QC, scientists can launch pipelines such as cell2location for deconvolution in spot-based assays, RTCD, or marker-based approaches referencing PangloDB. These methods enable flexible annotation across technologies.
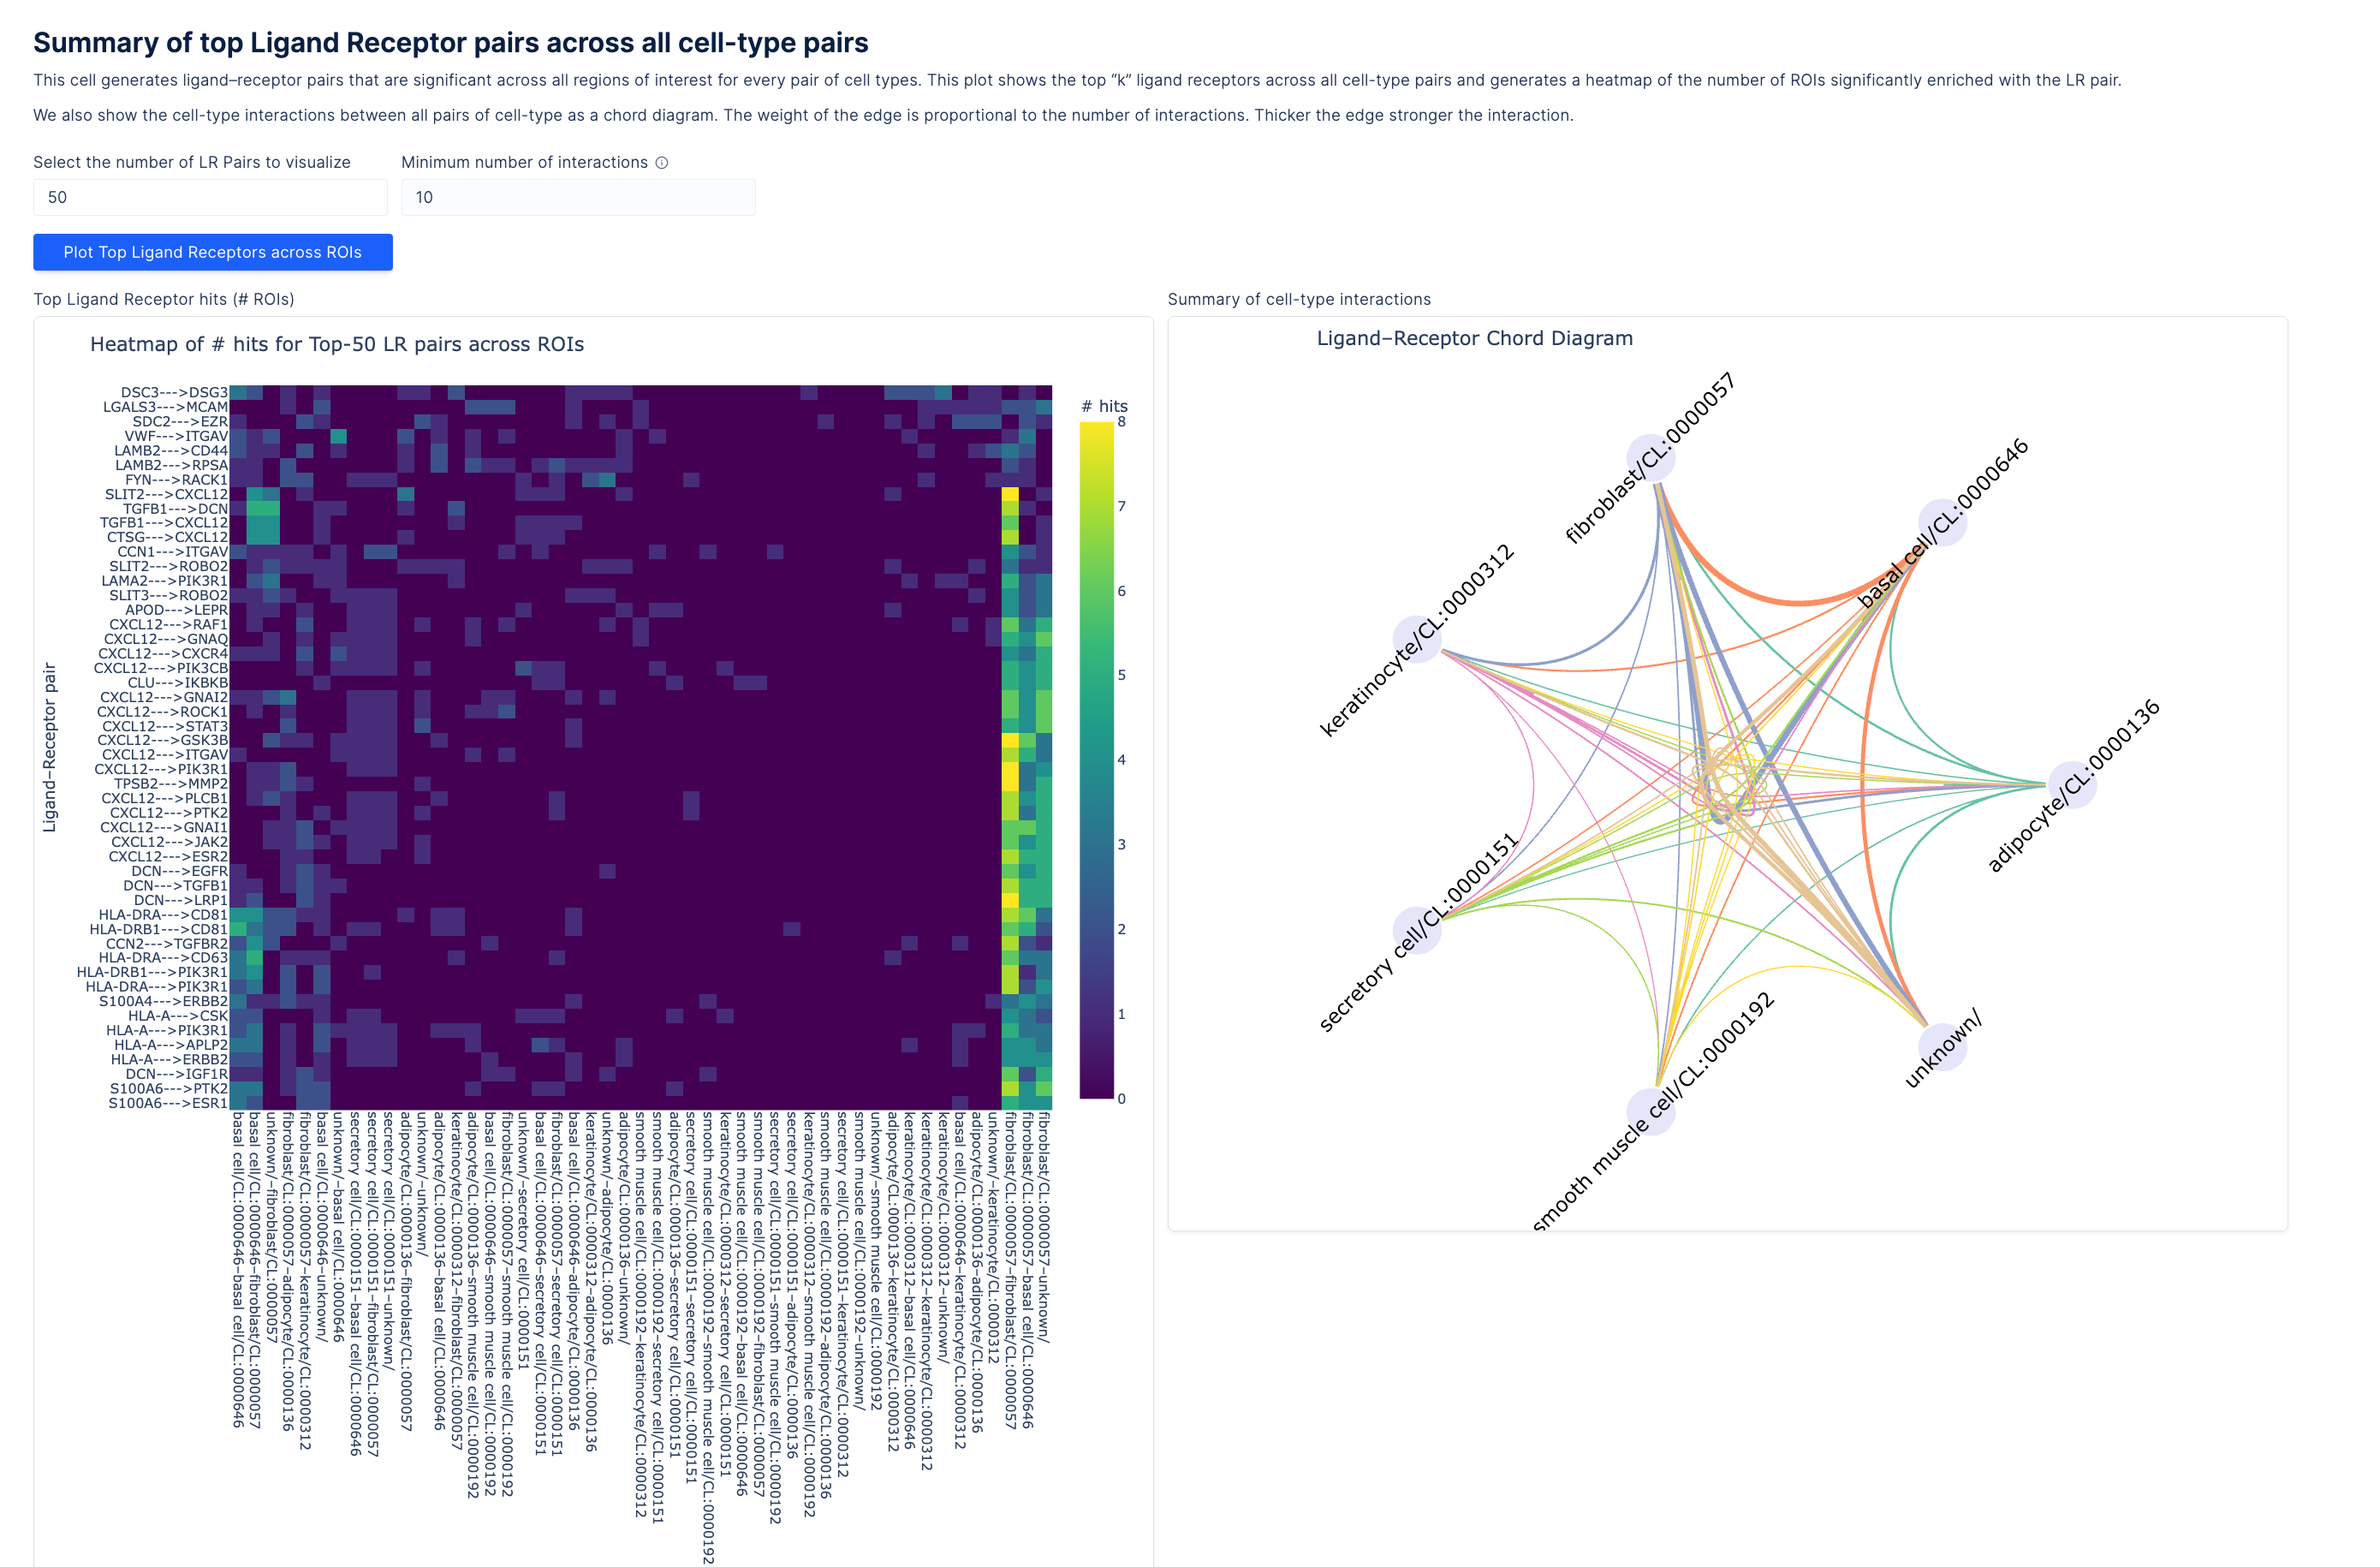
Ligand-receptor analysis
Once cell types are annotated, the next question is how they interact. Squidpy’s ligand-receptor module evaluates large numbers of spatial permutations, often at high computational cost. To increase focus and efficiency, scientists can use the viewer’s lasso tool to define regions of interest, ensuring interaction analysis captures only spatially proximal, biologically plausible events. Results are returned as plots of ligand–receptor pairs between cell types.
anntiles: tiled AnnData served directly from blob stores
To see a bird’s-eye view snapshot of the results generated by these tools, navigate to our Data Portal (console.latch.bio/data-portal) and click “Visualize” on our top featured datasets.
Our team has created a tiled AnnData file format (`anntiles`) and a suite of visualization tools that enable exploration of very large matrix-based counts data without spinning up a server. These tools will be released soon and are used to implement the notebooks exposed through the link above.
If you are a scientist interested in accessing these toolkits, please reach out and we will send you a link to access!
If you are a solution provider interested in white-labeling these tools and offering them to customers through a branded portal, contact alfredo@latch.bio. If you are interested in co-developing exciting new spatial tools and collaborating on our roadmap reach out to hannah@latch.bio.