
Agents for Spatial Biology
Tailored to Vizgen, 10X, AtlasXOmics, Takara. Powered by Anthropic.


The core driver of exponential data generation in biology are new kits and machines that measure molecules with increasing throughput. Spatial biology experiments are particularly representative, allowing scientists to look at the RNA, proteins, epigenetic signatures in their tissue and explore how this molecular state pairs with visual features to understand disease, development and so forth.
Unlike most experiments in biology, the computational steps in spatial can match or exceed the resources spent on upstream work in the wet lab: a tricky combination of the data being large (>1TB a run for CosMX) but the analysis high-touch, multi-turn and very unique to each scientists’ questions. This is unfortunate because most biologists have a very clear idea of what they are trying to do, often able to describe the end results/plots with great detail and steer intermediate steps based on their biological goals. But the practical complexity of using spatial tools complicates the translation of the correct ideas to the right analysis. Tens of thousands of scientists across industry and academia are stuck analyzing spatial data .
Agents are LLMs in loops that plan and execute end-to-end analysis with natural language directions by interacting with their environment and calling tools. They have shown incredible promise in math and programming, but require intentional engineering to translate well to biological data. Latch spatial agents are tailored to the details of each kit, in direct collaboration with the companies that sell them, so they have the specific context, tools and structured analysis flows required for each type of data. They build scientific notebooks with interactive widgets running on large machines and launch workflows on purpose built data infrastructure engineered for scale.
We are in the early days of this emerging category, but the initial technical results and response from scientists indicate this is likely the future of data analysis. There is considerable work left to do, but it seems base reasoning and agentic capabilities of frontier models are essentially here, and the remaining structure of the problem is a long tail of incremental but very soluble engineering improvements. In the coming months, tens of thousands of scientists will be able to finally play with their own data and answer their own questions.
Agents for biological data are purpose built for the domain
Agents need new capabilities to reliably and accurately accomplish practical tasks with biological data. Unlike software engineering products, these systems need to run in sandboxes with considerable computing and storage resources to manipulate large data. They also need to offload particularly intensive steps to optimized workflow infrastructure; single operations, like processing sequencing reads or clustering counts, can take hours and require clusters of computers. Using pre-existing bioinformatics components as tool calls, like Nextflow or Snakemake workflows, also serves to constrain end-to-end workflow variability and allows models to focus on genuinely novel components of user requests.
Furthermore, the driver of the agent is a scientist who reasons about results with plots, charts and graphical components. Latch agents communicate with their users by building scientific notebooks, rich with markdown description, that also serve as self-documenting dashboards that describe the analysis in detail.
Perhaps most important, each agent is tailored to the specific type of machine or kit that generated the data. We work directly with the companies developing these assays when possible - Vizgen, TakaraBio, AtlasXOmics - to encode latent knowledge about the specific details, hidden footguns and ideal customer journey into prompts, tools and evals. Rather than an open-ended sandbox that does many things somewhat well, our philosophy is to build a surgical and highly reliable product that assay providers can trust. We believe the bar for widespread adoption of agents is an intelligent, adaptable system that does not jettison the determinism of traditional software.
Spatial data is a strong focus for early adoption
It is important to find specific tasks that are uniquely suited to agentic workflows and cause enough existing pain to encourage scientists to try a new tool. Spatial data checks both of these boxes. This is a new, rapidly growing but notoriously challenging domain of science. There are no clear analysis standards, the ecosystem of tools is highly fragmented and generally difficult to use, and unlike traditional sequencing, there are many different, composable steps. Yet the power of these assays is remarkable, in the new biology they help us understand and the beautifully intuitive way they allow scientists to see what’s going on.
In many ways, it is convenient agentic systems are beginning to actually work. It is unclear exactly what the solution to these problems would have been with traditional software: likely many variations of hard coded dashboards that each tackle a specific task in a reliable but brittle manner. We believe the interplay between spatial biology, which is going through its own revolution, and agentic data analysis is a special, reciprocal relationship. These complementing technologies will allow scientists to ask more, understand more and all the while consume more kits and compute.
What do agentic workflows look like in practice?
The following are four concrete end-to-end agentic workflows built in collaboration with real scientists. A tailored agent is built for each kit or machine type. Scientists begin with raw data, send instructions or questions to a chat interface (eg. “Process my Vizgen data”), and watch the agent build graphical scientific notebooks to accomplish tasks.
AtlasXOmics DBiT-seq Agent
AtlasXomics develops an assay called deterministic barcoding in tissue sequencing (DBiT-seq) that allows spatially-resolved epigenome profiling. Microfluidic chips deliver barcodes to precise tissue coordinates, uncovering relationships between chromatin accessibility, histone modifications, and context-specific gene expression within intact tissues.
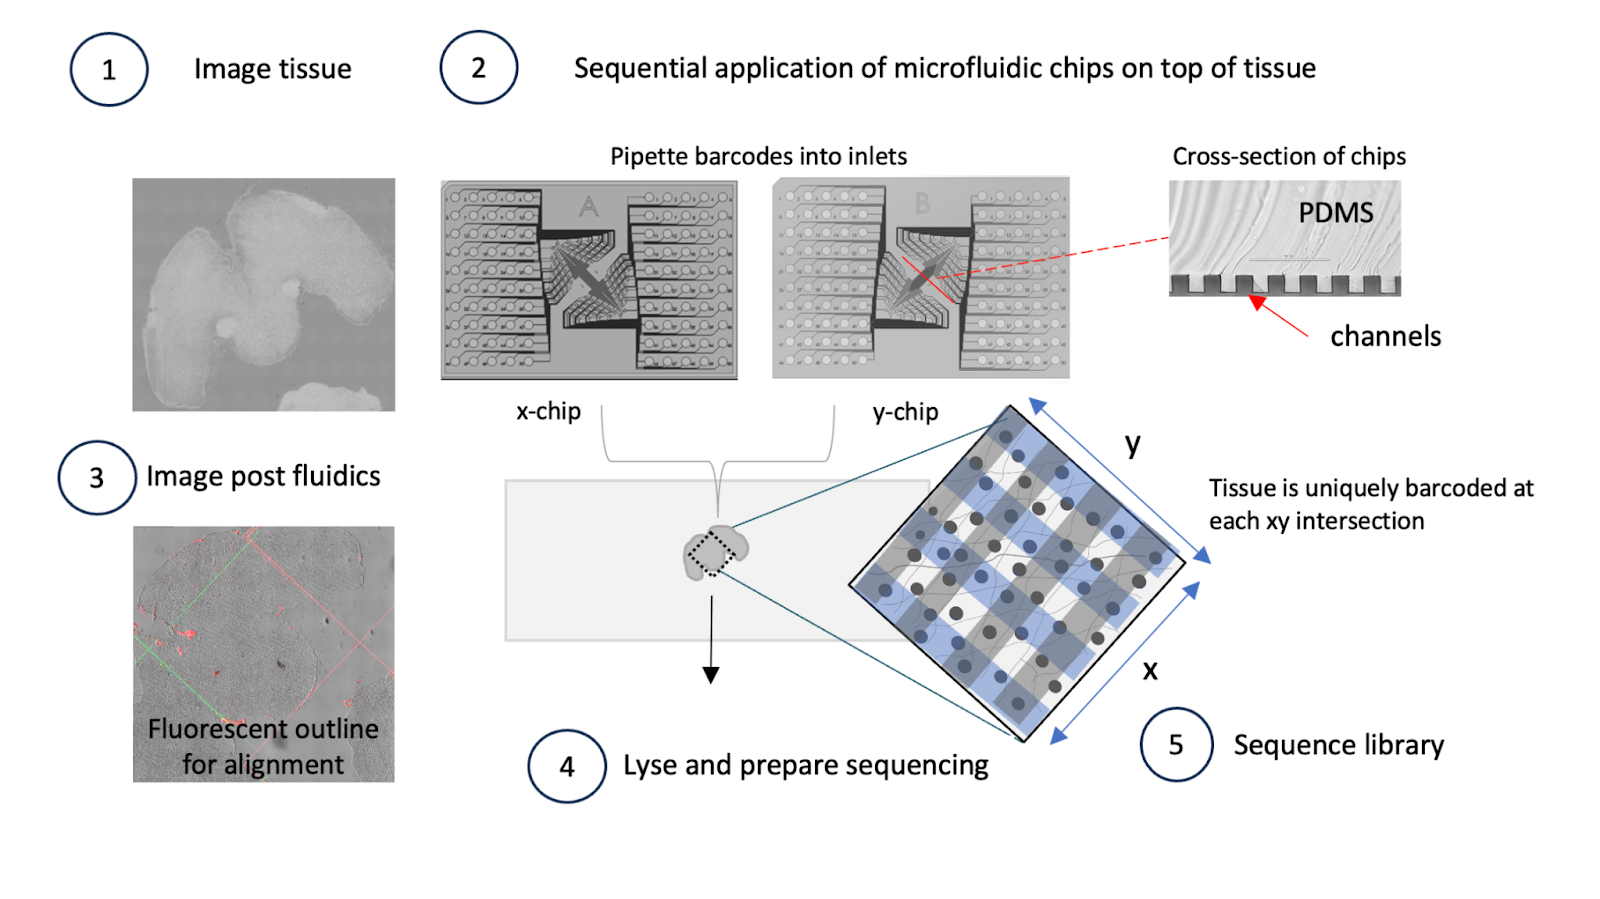
This first flow highlights the design principles discussed earlier: large agent sandboxes to handle the TBs of file data, the use of existing bioinformatics workflows developed by the AtlasXOmics team and specialized visualization components (H5, IGV viewer) required for this data type.
1/ Bioinformatics Workflows as Tool Calls
The AtlasXOmics agent begins by building interfaces to handle user input and dispatching bioinformatics workflows to purpose built data infrastructure. Reads are filtered, aligned to the reference genome, and converted into fragment files.
It understands the relevant files to pull from the output folder - filtered fragments, spatial position files, motif enrichment scores and gene activity scores - so scientists can immediately continue with downstream steps. Scientists can ask questions about workflow parameters at any point.
2/ Image Alignment
Linking molecular measurements to precise tissue locations requires careful alignment of sequencing data with high-resolution tissue images.
The agent guides scientists through this process using an interactive interface, providing instructions on how to perform alignment and suggesting adjustments when needed. The result is a spatially-aligned dataset where each molecular measurement is mapped to its exact tissue coordinate, creating the foundation for all downstream spatial analysis.
3/ Spatial Region Selection
Once the data is aligned, scientists need to define regions of interest based on tissue morphology or biological features. The agent enables researchers to use intuitive lasso-select tools to define custom regions
It can suggest regions based on expression patterns or guide selection based on natural language descriptions like “select the tumor border region.” These defined spatial regions are saved as metadata, ready for comparative analysis across different tissue areas.
4/ Differential Chromatin Analysis
Understanding regulatory differences between conditions, spatial niches, or cell types requires identifying differential chromatin accessibility regions and motifs. When scientists ask questions like “What chromatin regions are more accessible in the tumor core versus periphery?”
The agent launches the appropriate differential analysis workflow as another bioinformatics workflow, automatically navigating the Latch file system using the LPath API to find required inputs, and configures parameters based on the scientific question. The analysis produces differential peak results, motif enrichment comparisons, volcano plots, heatmaps, and gene regulatory network differences.
5/ Subclustering
Discovering subtle cell populations or states within major cell types often reveals distinct regulatory profiles crucial for understanding biology. When scientists want to explore specific cell populations in detail, the agent subsets the data based on user criteria and launches re-clustering workflows on the subset.
It then repeats annotation and differential analysis on subclusters while maintaining the full analysis provenance in the Latch Plots notebook environment. This iterative process yields refined cluster definitions and subcluster-specific regulatory signatures.
6/ Visualizing Chromatin Accessibility Tracks with IGV Browser
Understanding how chromatin accessibility differs between clusters requires examining the actual peaks and signal intensities at specific genomic loci. When scientists want to validate differential accessibility results or explore regulatory elements in detail, the agent launches an IGV browser session and automatically loads cluster-specific chromatin accessibility tracks as bigWig files, with each cluster displayed in distinct colors for easy comparison.
Scientists can navigate to genes of interest by simply asking “Show me chromatin accessibility at the IL2 locus across T cell clusters,” and the agent configures IGV to display the relevant tracks, adjusts the viewing window, and highlights differential peaks. The agent can also overlay additional tracks like gene annotations, known enhancers, or transcription factor binding sites, providing the full genomic context needed to interpret spatial epigenetic differences.
Takara Trekker Agent
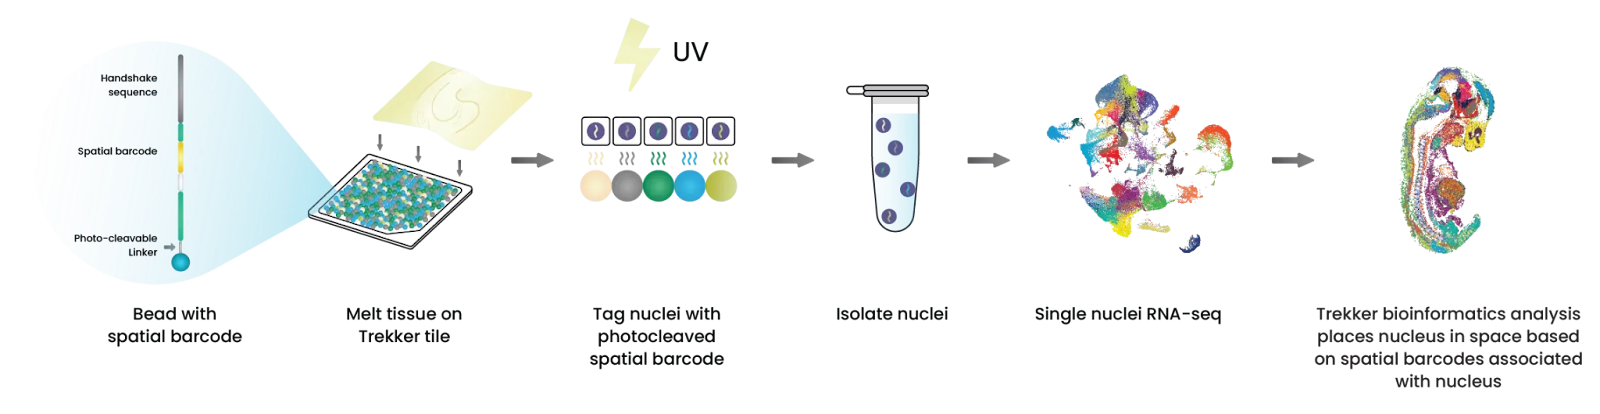
TakaraBio offers two spatial transcriptomics platforms. This flow focuses on Trekker, a single nuclei spatial transcriptomics kit.
We show the agent’s ability to gather experimental context, launch chemistry-aware bioinformatics workflows, guide scientists through tissue image alignment, and discover insights through multi-sample differential gene expression analysis.
1/ Gather Experimental Context
The chemistry of each assay dictates the structure and content of its sequencing output and therefore the architecture of its downstream computational analysis. To enable robust interpretation, we codified assay-specific scientific logic into our agentic framework, allowing our Latch agent to reason about experimental design, platform chemistry, and expected data modalities.
The agent is trained to ask clarifying questions about the kit chemistry, sample type, and sequencing platform before constructing the appropriate workflow. This ensures that each dataset is processed using a computational path aligned to its biochemical origin, enabling accurate spatial reconstruction and downstream biological analysis.
2/ Chemistry-specific Bioinformatics Workflows
The workflow ingests paired FASTQ files alongside output from a single-cell platform (e.g., 10x or BD Rhapsody). Each read encodes a cell barcode, molecular identifier, and spatial barcode. The Takara spatial informatics pipeline identifies nuclei carrying valid spatial barcodes, reconstructs the spatial index, and generates a cell × gene matrix that integrates molecular expression with spatial localization.
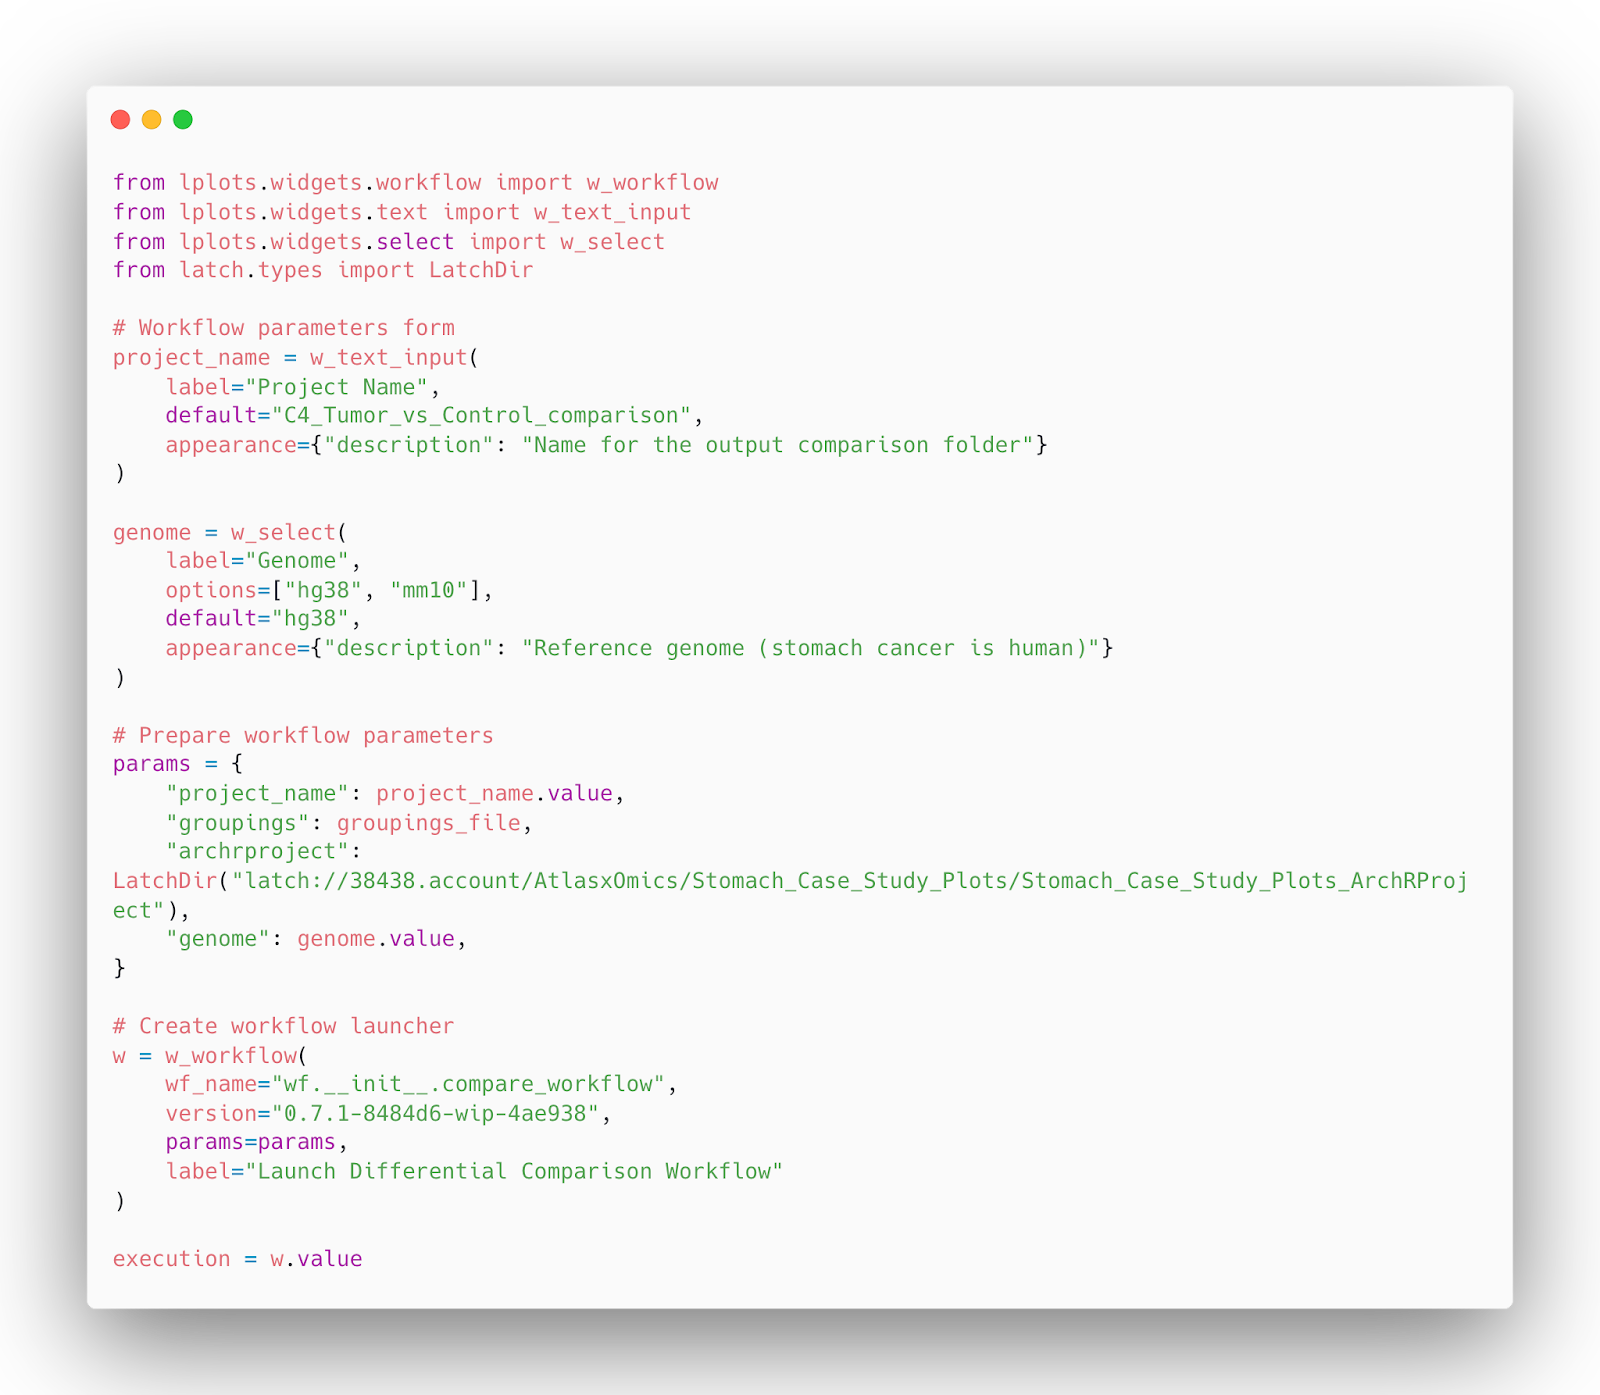
When prompted with, “Process FASTQ files from a Takara Trekker experiment,” the agent dynamically generates a configuration interface to capture parameters such as the single-cell platform, kit version, and output format. It then invokes the appropriate Latch `w_workflow`, which executes on dedicated high-performance infrastructure to produce an H5AD object ready for visualization in the Latch plotting environment.
2/ Image Alignment and Tissue Visualization
Seeing gene expression overlaid on tissue structure is crucial for understanding spatial data. However, aligning H&E-stained images with spatial coordinates is challenging and often requires manual tweaking. The agent simplifies this using built-in image registration tools in the H5 viewer.
When prompted, the agent automatically focuses on the tissue region and overlays the H&E image with the spatial data. For ovarian tissue, this alignment reveals how gene expression maps to anatomical features: follicles appear as distinct circular structures, corpora lutea show as larger irregular regions, and the surrounding stroma displays its own expression patterns. This visual overlay lets researchers immediately connect molecular data with tissue architecture.
3/ Differential Gene Expression Across Follicular Subtypes
We also demonstrated the agent’s ability to conduct differential gene expression analyses across ovarian follicle subtypes—preantral, antral, and atretic—within Seeker-derived datasets. This analysis established a spatially resolved baseline for folliculogenesis, linking molecular identity to anatomical localization, revealing spatial gradients in follicle maturation, and identifying novel, spatially restricted gene markers critical to understanding ovarian development.
When extended to temporal dynamics, the agent identified stage-dependent changes in gene expression following hCG induction, including a decline in Fabp3 and Inhbb levels over time, marking the transition of mural granulosa cells from a proliferative, follicle-maintaining phenotype to a luteinizing, pre-ovulatory state.
Vizgen MERSCOPE Agent
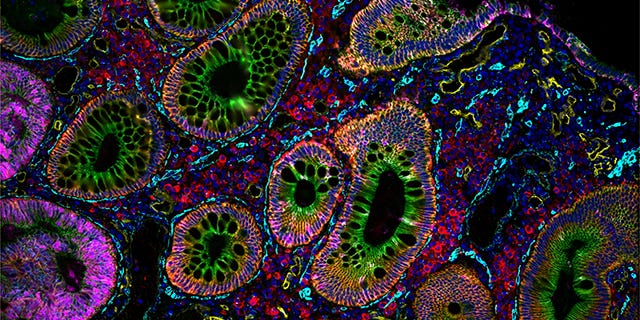
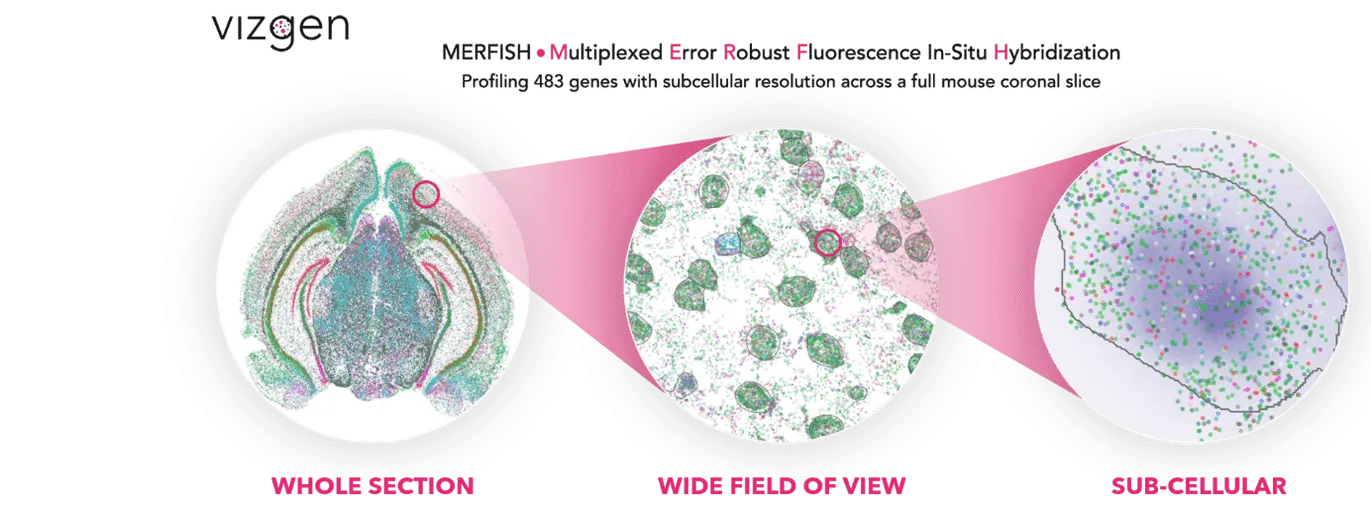
Vizgen’s MERSCOPE platform uses multiplexed error-robust fluorescence in situ hybridization (MERFISH) to map hundreds to thousands of RNA species simultaneously at subcellular resolution. Each experiment generates terabytes of data: millions of transcript coordinates, multi-channel z-stack images, and complex metadata files.
We show the agent’s ability to process TB scale MERFISH human brain imaging data, launch GPU-accelerated cell segmentation workflows, enable interactive visualization of millions of transcripts in the browser, and perform spatially-aware differential expression analysis through natural language commands.
1/ Cell Segmentation
Cell segmentation determines how millions of detected transcripts get assigned to individual cells. MERSCOPE captures five imaging channels across seven z-planes: DAPI (nuclei), three Cellbound channels (membranes), and PolyT (cytoplasm). Creating accurate cell boundaries requires selecting the right channel combinations and configuring GPU-accelerated algorithms like CellPose or Baysor.
The agent automates this complexity by scanning imaging directories and generating configuration files tailored to each tissue type. For dense tumor regions, it prioritizes membrane channels; for sparse samples, it leverages Baysor’s transcript-based approach. It then launches a GPU-powered workflow on Latch infrastructure to process the segmentation.
The workflow outputs three files: (1) an AnnData object compatible with downstream tools like Scanpy and Squidpy, (2) PMTiles (a pyramidal format originally developed for web mapping that enabling smooth zooming and panning), and (3) a DuckDB database containing transcript coordinates and metadata, providing a lightweight SQL engine for querying millions of transcripts in real-time.
These files are displayed in the Latch H5 viewer, where scientists can seamlessly overlay cells, transcripts, and high-resolution morphology. They can also filter transcripts by gene, spatial region, expression level, or cell type while exploring tissue architecture at any zoom level.
If segmentation needs refinement, scientists can immediately instruct the agent to rerun with adjusted parameters, creating a rapid iteration cycle for optimal results.
A video of agent performing all analysis steps end-to-end for Vizgen data, from QC, normalization, finding HVGs, to cell type annotation and differential gene expression
2/ Quality Control
With cells defined, quality assessment becomes critical. MERSCOPE’s large imaging area can harbor technical artifacts: edge effects, tissue folds, or regions with poor probe penetration that must be identified before analysis. The agent generates spatial QC plots revealing these issues, allowing scientists to set informed filtering thresholds that preserve biological signals while removing technical noise.
3/ Clustering and Cell Type Annotation
MERFISH panels contain 200-1000 genes carefully selected to distinguish cell types in specific tissues. The agent exploits this focused design, performing clustering at resolutions that match expected cellular diversity. Initial annotation queries reference databases for marker patterns, then scientists refine through natural language: “split the myeloid cluster into monocytes and macrophages” or “identify proliferating cells across all types.” Spatial context often resolves ambiguous populations. Morphologically similar cells may occupy distinct tissue compartments that clarify their identity.
4/ Differential Expression Analysis
With cell types defined, scientists often ask what makes populations distinct or how they change across conditions. When comparing “tumor cells in the core versus edge,” it accounts for spatial autocorrelation and multiple testing across the focused gene set. Results highlight not just which genes differ, but their spatial patterns: gradients of metabolic genes from hypoxic cores to vascularized edges, or immune activation markers concentrated at tumor-stroma interfaces.
10X Xenium Agent
10X Genomics’ Xenium platform uses in situ hybridization to detect hundreds of RNA species at subcellular resolution. To demonstrate the agent’s capabilities, we’ll analyze an Alzheimer’s disease mouse model dataset tracking pathological changes across disease progression.
We show the agent’s ability to parse complex multi-timepoint Xenium datasets, refine cell segmentation in challenging brain tissue, detect spatial domains through BANKSY clustering, and calculate disease-specific gene signatures that reveal spatially-organized neuroinflammatory responses around amyloid plaques.
1/ Loading and Merging Xenium Data
The dataset compares wild-type and CRND8 transgenic mice at timepoints representing mild, moderate, and advanced amyloid deposition. Scientists attach Xenium outputs from coronal brain sections profiled with 347 genes: 248 from the Mouse Brain panel plus 99 custom genes targeting activated microglia, astrocytes, and plaque-inducible markers.
The agent parses the complex directory structure, constructs an AnnData object preserving spatial coordinates, and generates diagnostic plots.
2/ Cell Segmentation Refinement
Brain tissue presents unique segmentation challenges. Neurons range from tiny interneurons to large pyramidal cells spanning hundreds of microns. Around amyloid plaques, activated microglia cluster densely, creating cellular aggregates that standard segmentation often merges incorrectly.
When prompted to “improve segmentation around microglial clusters,” the agent launches a refined workflow. Cellpose first identifies nuclei using DAPI, providing reliable seeds even in crowded regions. Baysor then expands these boundaries guided by microglial transcripts like Iba1 and Cx3cr1. This approach captures the complex morphology of activated microglia wrapped around plaques–essential for accurately quantifying neuroinflammatory responses across disease stages.
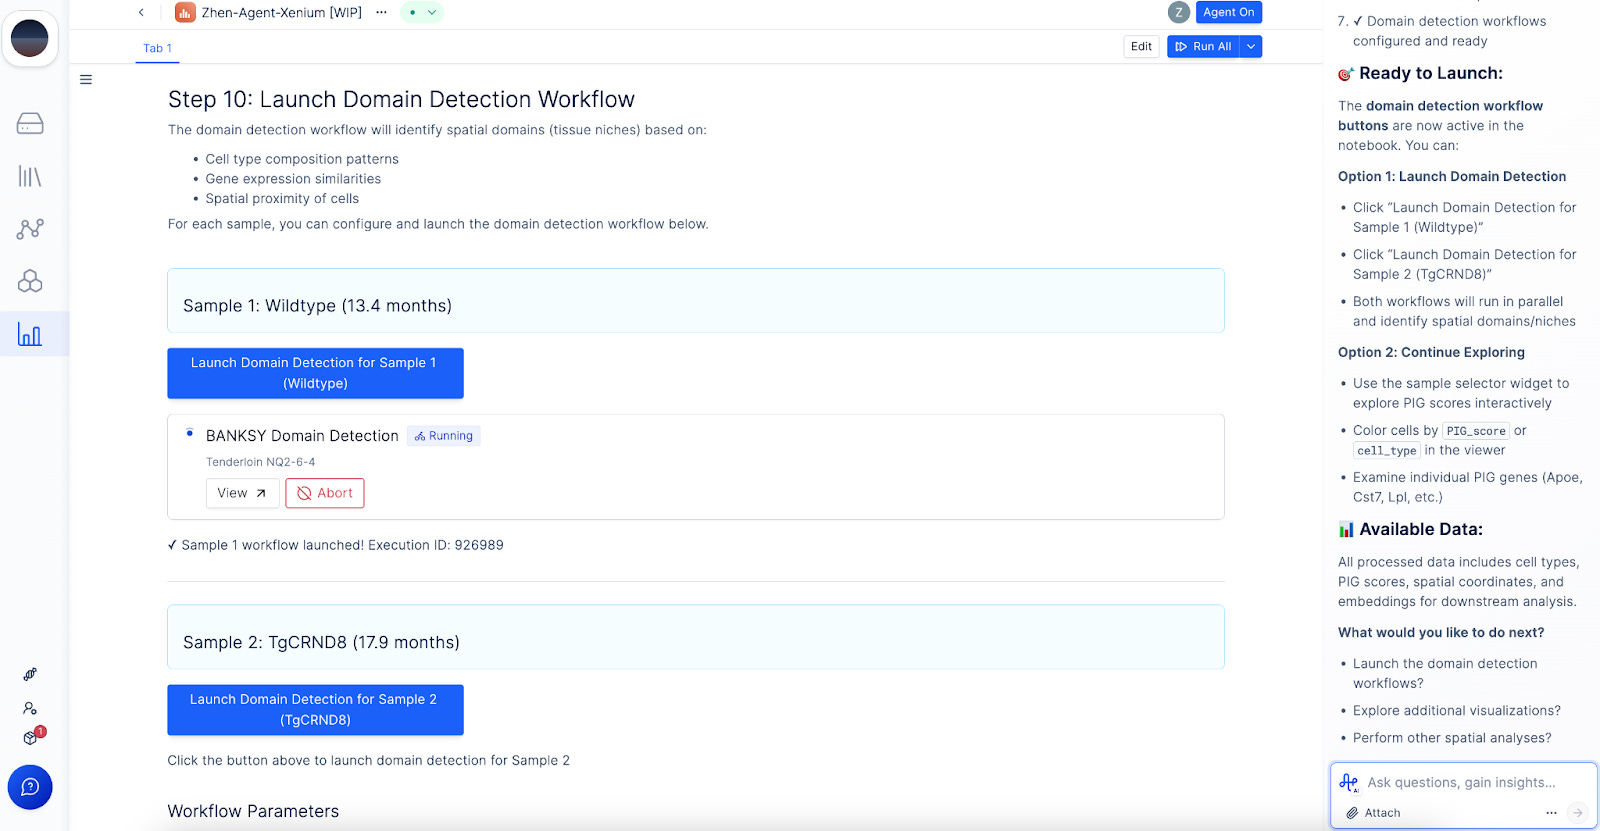
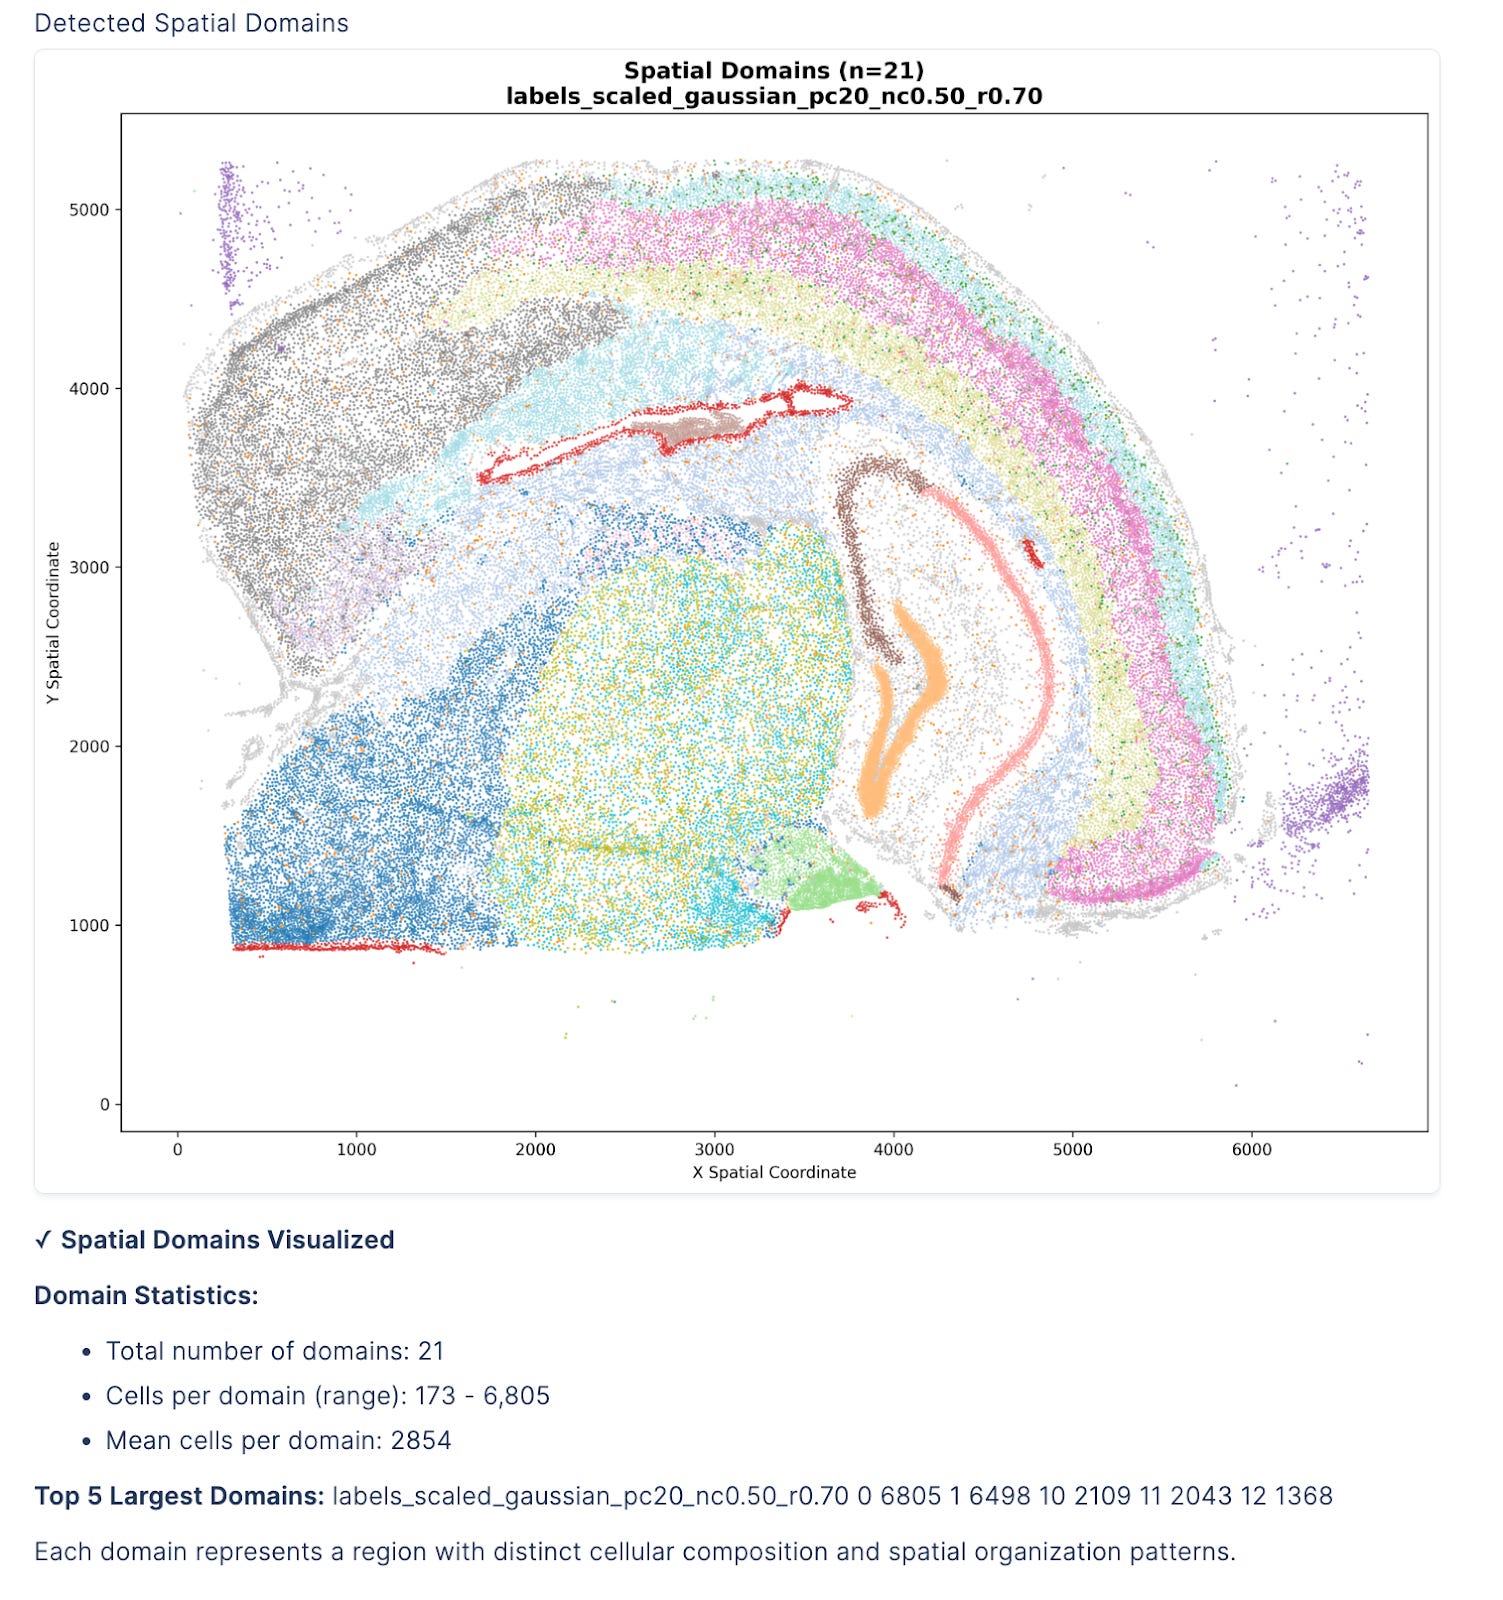
3/ Spatial Domain Detection
With proper segmentation complete, the agent reveals tissue organization through BANKSY clustering.
4/ Cell Type Annotation
Standard cell typing identifies expected populations, but the key insights come from disease-specific signatures. When scientists prompt to “compute PIG signature scores within microglia and astrocytes,” the agent executes a targeted analysis of plaque-induced genes, a curated set of markers that distinguish reactive from homeostatic glia in Alzheimer’s pathology.
The agent first identifies microglia and astrocytes using canonical markers, then calculates PIG scores incorporating genes like Apoe, Cst7, and Axl for microglia, and Gfap, Vim, and Clu for astrocytes. These scores are mapped spatially, revealing striking patterns: microglia closest to plaques show the highest PIG scores, forming a reactive barrier, while astrocytes display elevated scores in broader halos around pathological sites.
Try it
Shoot us an email at contact[at]latch.bio to get onboarded. Lots of work to be done, but we have certainly seen early signs of the magic. We believe this will soon be the standard way biologists interact with data.
Amazing work! Going to forward to my colleagues who do spatial transcriptomics work in cancer resey
Impressive - signed up to try this!