


Knowing which respiratory viruses are circulating, how they’re changing, and who they’re infecting is one of public health’s most persistent problems. COVID showed the cost of answering too slowly, as surveillance systems built for known threats struggled to keep up with a novel one. Flu tests us differently. It returns every year, but each season shifts in intensity, timing, and the strains driving it.
Answering these questions is a career’s worth of work. Lab scientists check whether diagnostic tests actually catch infections. Bioinformaticians dig through sequencing data to identify viruses and trace their spread. Epidemiologists comb clinical records and environmental data to see where infections are climbing and how much harm they’re doing. This work provides the evidence behind public-health responses, and we wanted to know whether today’s AI agents can answer these questions.
We built BioSecBench-RespiratoryVirus-Surveillance to find out. The benchmark contains 110 questions spanning diagnostic assays, pathogen discovery, viral evolution and transmission, and population surveillance. Each question asks an agent to analyze source data and produce an answer checked against task-specific grading criteria. We tested 21 models across 34 combinations of models and agent software, with three attempts per question for a total of 11,220 trials. The highest preliminary pass rate was 25.5%.
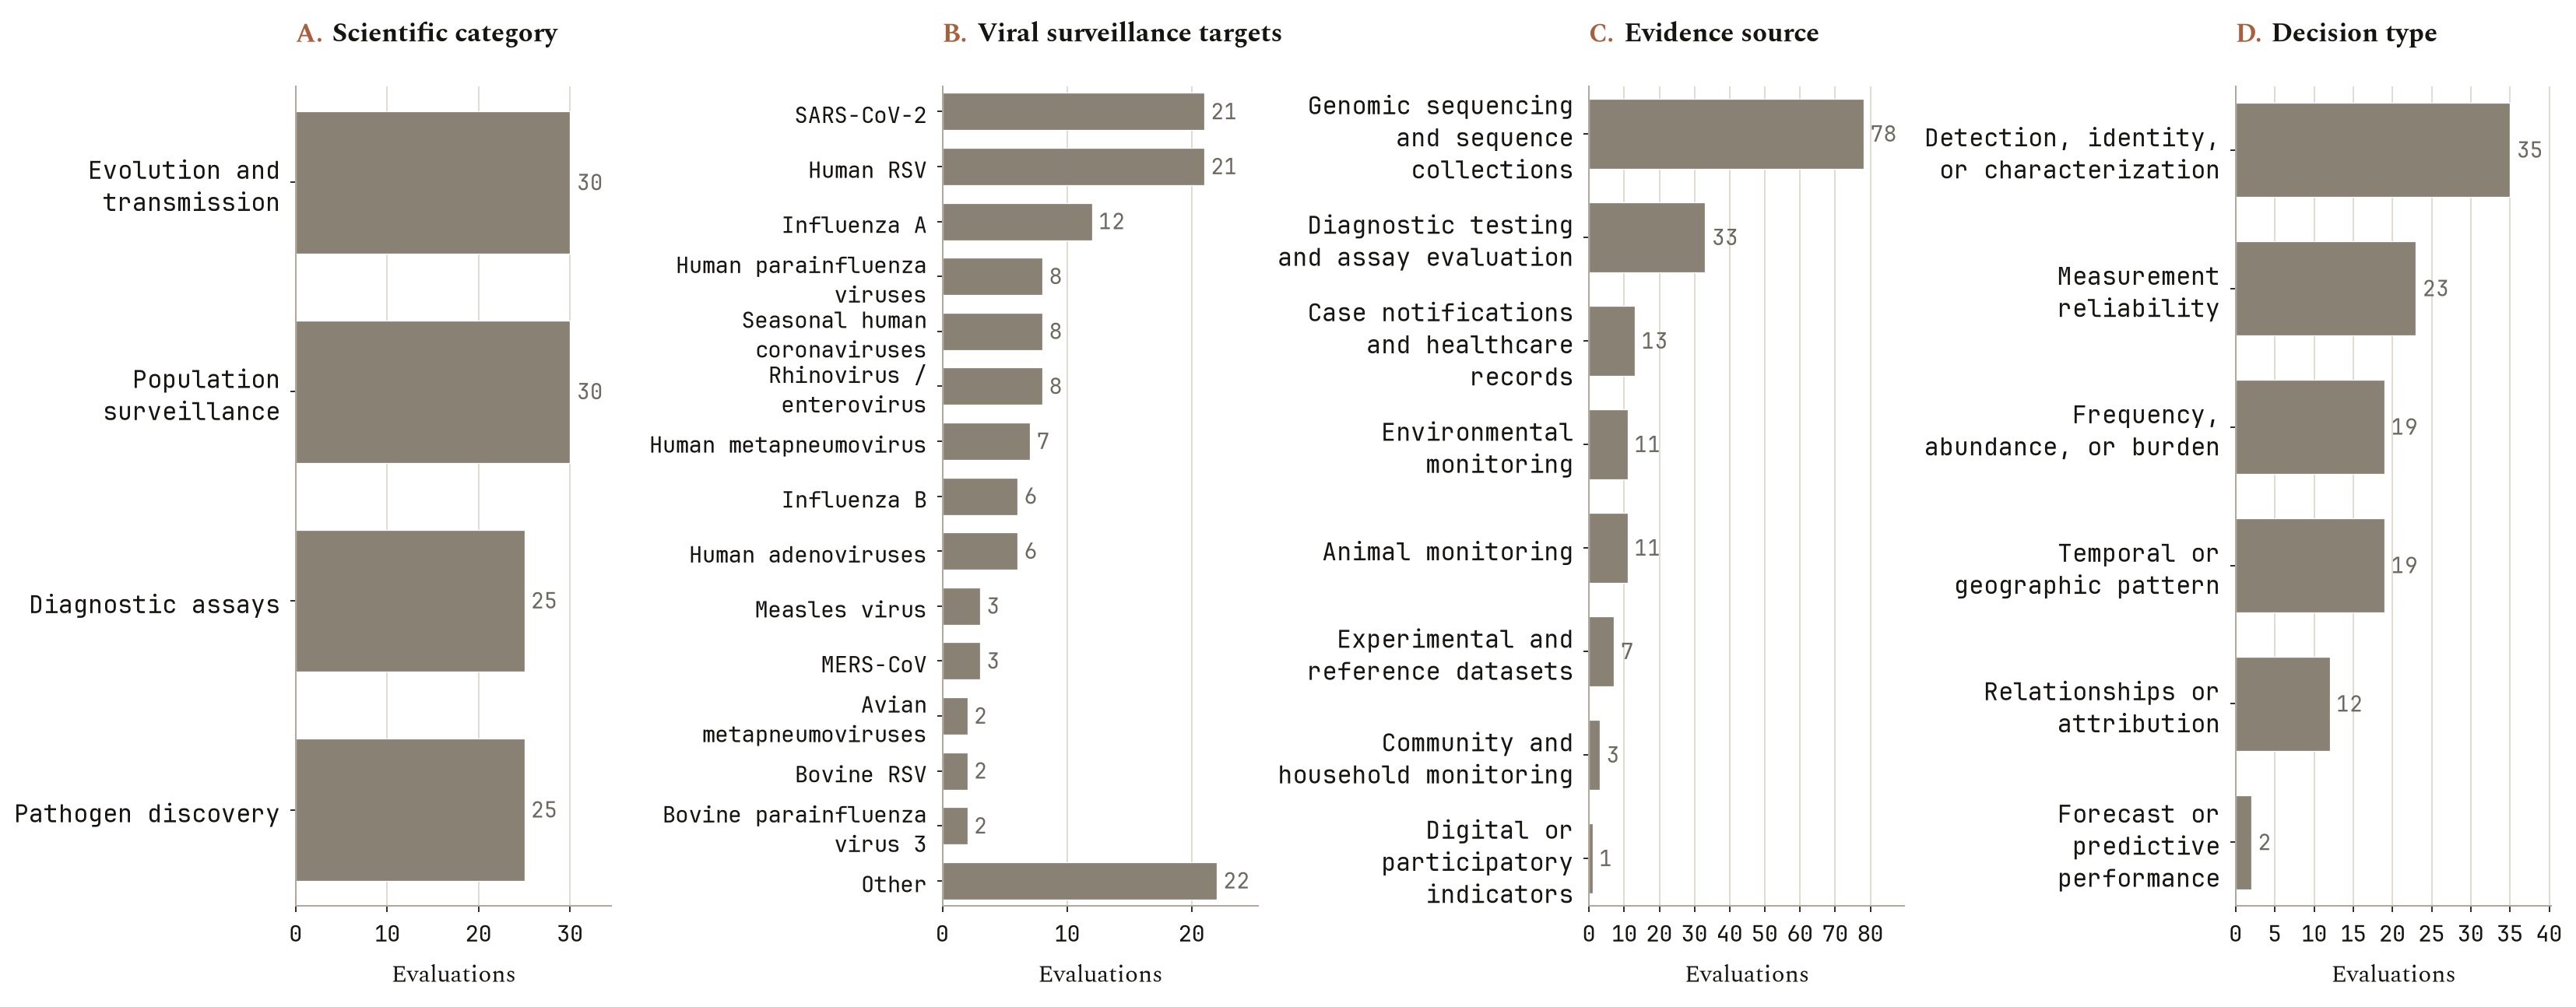
At a glance
The best setup, Opus 5.5 on Pi, got 25.5% right.
Population surveillance was the hardest area: tasks on circulation, burden and forecasting passed 4.3% of the time.
The most common failure was misjudging what is an artifact and what is biology, the main failure in 48 of the 110 evaluations.
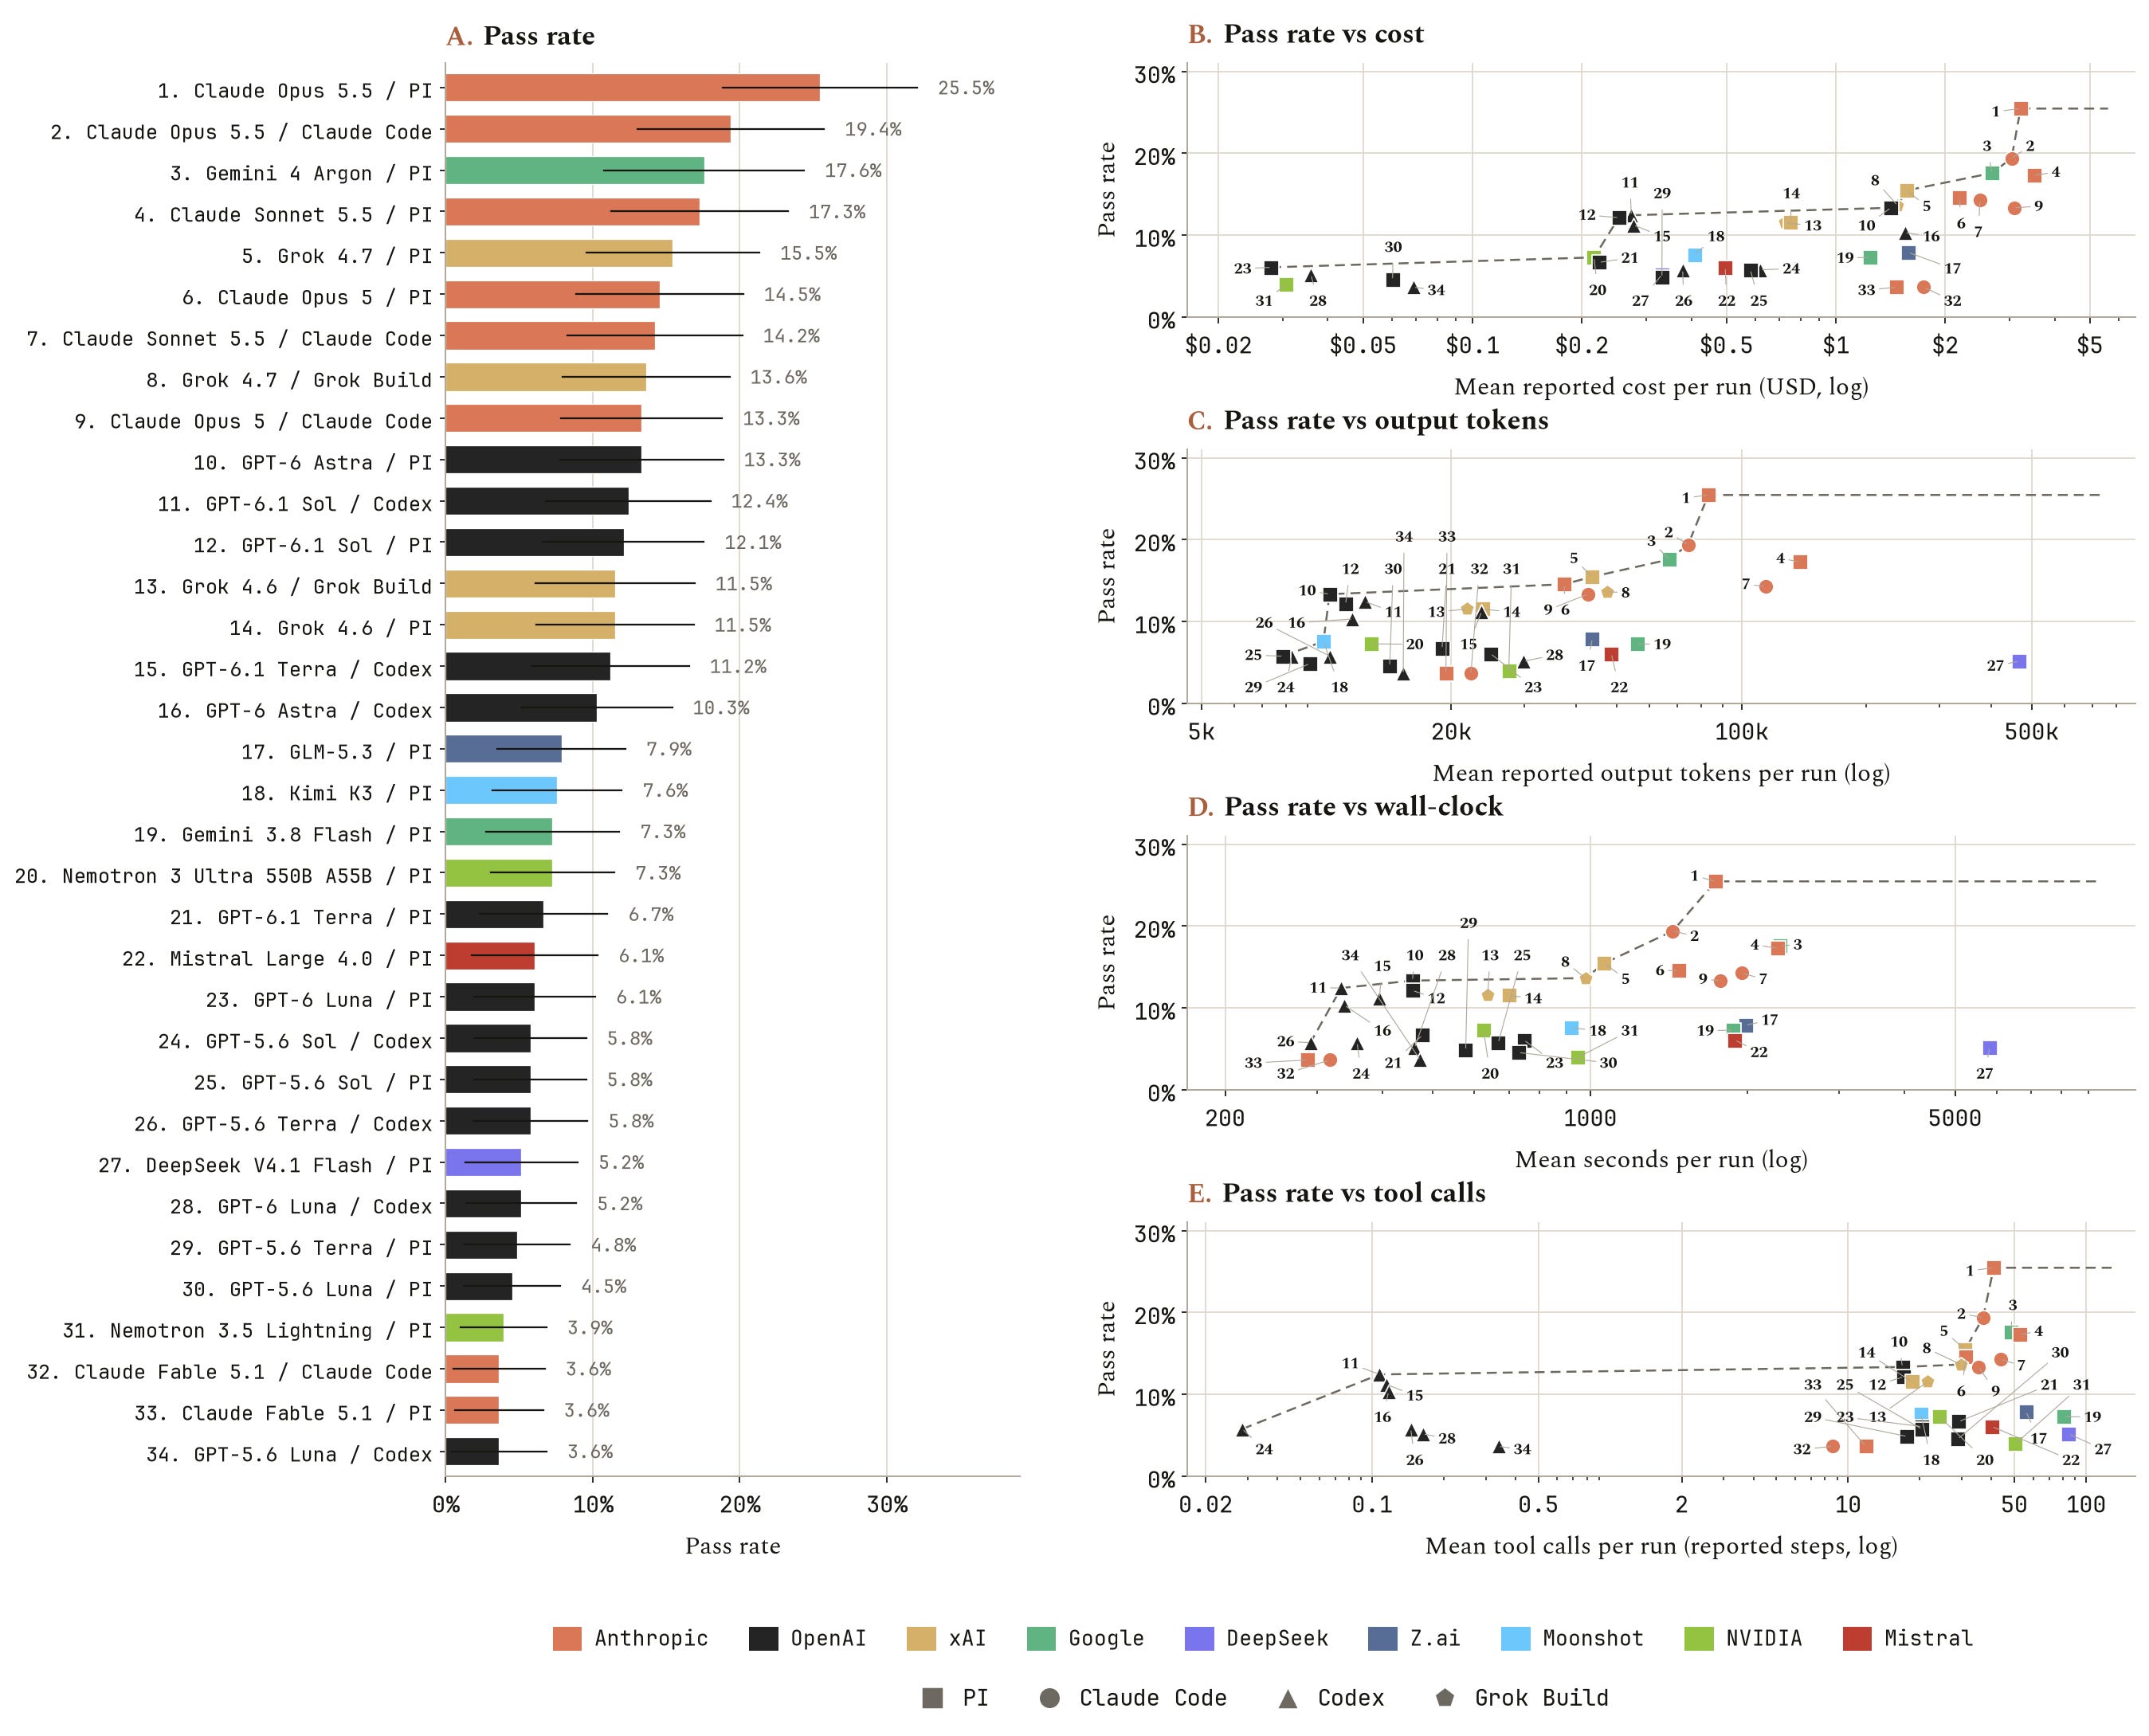
The leaderboard
The highest pass rate was 25.5%. Opus 5.5 on Pi topped the table, just ahead of Opus 5 on Claude Code (19.4%) and Gemini 4 Argon on Pi (17.6%). At the bottom, three setups tied at 3.6%: GPT-5.6 Luna on Codex and Fable 5.1 on both of its harnesses. Fable 5.1 refused more than 70% of its attempts, and refusals count as failures.
At least one setup solved 74 of the 110 evaluations in at least one attempt. The other 36 were never solved.
For seven of the 13 models we ran on two harnesses, the two scores were within one percentage point. Opus 5.5 was the exception, scoring 6.1 points higher on Pi than on Claude Code.
Cost did not track accuracy. Gemini 3.8 Flash and Nemotron 3 Ultra, both on Pi, passed the same share of attempts (7.3%), at $1.24 and $0.22 per run.
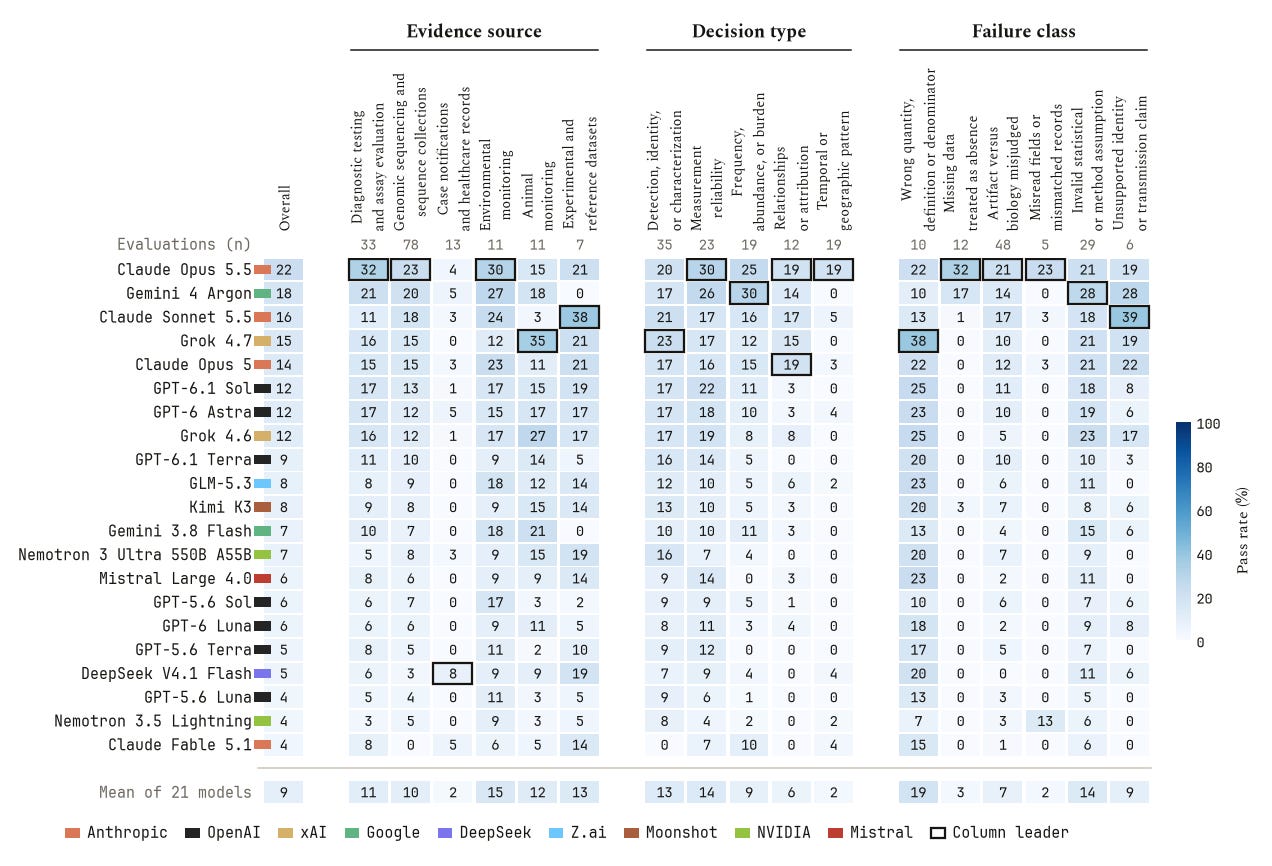
Models struggled most with population surveillance
Population surveillance tasks passed 4.3% of the time. Averaged over all 21 models, that compares with 16.7% for pathogen discovery, 10.9% for diagnostic assays and 7.3% for evolution and transmission. Population surveillance was the lowest-scoring area for 16 of the 21 models. Tasks built on case notifications and healthcare records averaged 1.8%, and no model passed more than 7.7% of them.
No model led every group. Opus 5.5 had the highest overall pass rate, but Grok 4.7 passed 34.8% of the animal-monitoring tasks to Opus 5.5’s 15.2%. Sonnet 5.5 led the evaluations whose main failure was an unsupported identity or transmission claim, at 38.9% to Opus 5.5’s 19.4%. Six models led or tied for the lead in at least one of the 17 groups.
25.5%: the highest pass rate of any setup
74 of 110: evaluations that at least one setup solved
4.3%: the average pass rate on population surveillance tasks

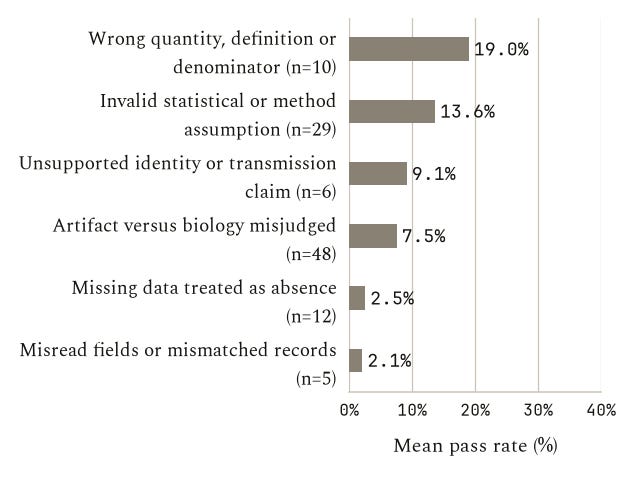
Telling artifacts from biology was the most common failure
To see what went wrong, reviewer agents read all 8,416 completed attempts that failed and labeled the mistake in each. Each evaluation is then grouped by its most common mistake.
Misjudging artifacts was the main failure in 48 of the 110 evaluations. Those evaluations averaged 7.5%. Models went wrong in both directions: they accepted sequencing, pipeline or reporting artifacts as real signal, and they dismissed real signal as noise or contamination. Opus 5.5 led this group at 21.2%, so the low average is not only a matter of weaker models.
Two smaller groups were close to unsolved. Evaluations where the main failure was misreading fields or mismatching records (5 evaluations) averaged 2.1%, and those where missing data was treated as absence (12 evaluations) averaged 2.5%. In each group, 17 of the 21 models passed none.
An interesting aspect on population surveillance: Philip Noris, Vice President of R&D at Vitalant (formerly Blood Centers of the Pacific, BCP) published a very interesting paper demonstrating how post-donation information could detect an infectious disease outbreak weeks before it became apparent, which could be crucial for early detection and response during a global pandemic.
Manuscript (2022): https://www.jci.org/articles/view/159876
Blood banks have a policy to collect post-donation information (PDI). If someone gets sick within a week or two of donation, the donor can call the blood bank to let them know so that they can quarantine the unit. You can see in Figure 1 that the spikes in PDI calls preceded the spikes in death from COVID during the pandemic. They were able to detect viremia in their pre-symptomatic blood donation sample in about 10% of donors during the spikes in COVID activity (Fig. 2A).
PDI could therefore be another valuable evidence source for early pandemic surveillance. It could also help estimate the interval between detectable viremia and the onset of symptoms, an important parameter for understanding pathogen transmission dynamics. A prolonged asymptomatic infectious period, for example with HIV-1 and HBV, could increase the risk of undetected transmission.