End-to-end Data Infrastructure for qPCR
stream files from qPCR machines, replace spreadsheet calculations + clicking with programmable dashboards, generate publication-quality ∆∆Cq plots backed by Python, construct schemas for metadata
Most of the biotech industry runs on qPCR. Its low cost, simplicity and maturity has established the technique as a staple in many molecular biology workflows.
However, the analysis of the downstream data is anything but standard. Most scientists spend hours passing files between Excel and GraphPad Prism, where they analyze data with error-prone spreadsheet calculations and manually plot their results. Results can change with each experiment and there is no record of the exact sequence of operations that modify tables and plots. There is also a large productivity drain on the pace of R&D as the hours of clicking accumulate over time.
These experiments often examine properties of single, high-value candidates and sit closer to IND-enabling studies than multi-omic experiments, so issues with reproducibility and compliance can delay or prevent filings. Unfortunately, most biotechs focus software resources on experiments that require large computing resources, like sequencing, and neglect biochemical assays, like qPCR, with these half-baked but somewhat functional existing solutions.
There is a need for modern analysis tools to manage the full lifecycle of qPCR data, supporting the following core steps:
The central and structured capture of qPCR machine outputs and experimental metadata
An automated and reproducible method for computing Cqs + ∆∆Cqs, and producing plots, that does not rely on error-prone clicking or spreadsheet formulas
Links between raw machine outputs, tables of Cq calculations and final plots
Here we present the full analysis lifecycle of qPCR on LatchBio to answer the following biological questions:
How do my raw Cqs vary between wells?
What are the ∆∆Cqs for each condition?
How does the fold change of my target gene change between conditions?
Connect qPCR Machines to Central File Storage
qPCR analysis begins with a successful run on a machine. Files need to be automatically deposited in central cloud storage without disrupting scientists’ workflows.
Latch can be installed on qPCR machines where it will automatically upload well data at a regular cadence. Many teams also choose to drag and drop files into a shared Google Drive account, where Latch has a direct integration (demonstrated above).
Associate qPCR Runs with Experimental Metadata
Associating well data with necessary metadata from the wet lab is necessary for flexible downstream analysis and data re-use long into the future.
Registry allows scientists to fill out structured schemas, to capture experimental context, and associate directly with raw machine files + results.
Configure Experimental Design
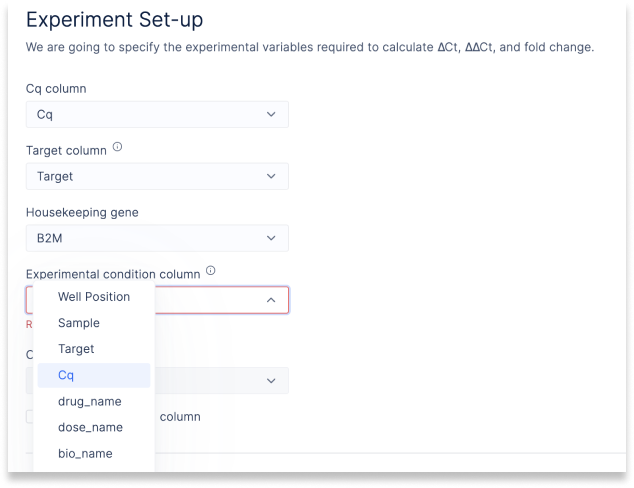
Experimental designs are very individual and complex. The structure of housekeeping genes, condition columns and control values vary from scientist to scientist.
Graphical widgets “react” to ingested files and change their selection options to sensible values. Scientists can configure complex experiments with a few clicks and bring in additional variables, like dose and drug name, to annotate wells. The underlying Python for these widgets can be accessed for modification or extension.
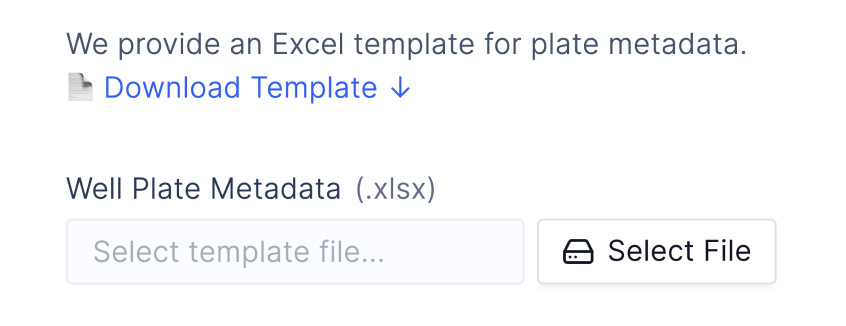
We support Excel files containing QuantStudio data or any CSV file as input. After user testing with many scientists, we found many prefer Excel to fill out additional well plate variables, and provide downloadable well-plate templates to avoid disrupting trusted workflows.
When the experimental design is configured, scientists can refer to a study design table to convince themselves the structure is correct.
Visualize Cqs
After the experimental design is configured, scientists can gut check their data by visualizing Cq by wells.
Scientists can generate publication (or slide deck) quality visualizations with graphical control over eg. plot type, formatting, color scheme, labels. This is all backed by editable Python.
Calculate ∆∆Cqs without Spreadsheets
Scientists can compute ∆∆Cqs with a button click and without spreadsheet formulas. Anyone on the team can access and modify underlying Python code.
Results are exported as a standardized CSV, making it easy to compare experiments downstream.
Remove Outliers
Outliers usually indicate some out of distribution event in the lab, like a pipette error, and are often removed manually. This process is non-standard and can vary based on human error and the mood of the scientist.
A few clicks run the statistical methods, backed with Python code, to automate this process on Latch.
Install Latch for qPCR
Latch is a modular and highly programmable data infrastructure designed to orchestrate wet and dry lab teams for deeper + faster biological consensus. For more information about the components of the platform, peruse our documentation:
We work with over 100 biotechs, ranging from fledgling startup to top 20 biopharma, and invest heavily in support and customer obsession. Our bioinformatics and engineering services team would love to partner with you on your next project. Book a Demo.
—
User Wiki (including a description of the methods used)


this is pretty cool!
What model qpcr machines do you put the software on?