
EpiBench: AI agents still struggle with epigenomics analysis
Benchmarking frontier models on practical CUT&Tag/CUT&RUN, ATAC-seq, ChIP-seq, and DNA methylation workflows

We introduce EpiBench, a verifiable benchmark for short-horizon epigenomics analysis.
Epigenomics workflows are full of small scientific decisions: aligning reads, reasoning about measurement units, calling peaks, annotating genomic features and constructing appropriate statistics based on experimental design and context.
EpiBench deconstructs real analysis workflows into 106 deterministic evaluations across CUT&Tag/CUT&RUN, ATAC-seq, ChIP-seq, and DNA methylation workflows. Each task starts from a realistic workflow state immediately before a target result. The agent receives files, metadata, and task context, then has to inspect the data and submit a structured answer.
Epigenomics analysis is hard for current agents
The tasks are difficult for modern agentic systems. Some examples:
In CUT&RUN spike-in normalization, agents had to decide how to align spike-in reads.
In WGBS methylation outputs, agents had to decide how to count a CpG when Bismark reports strand-level rows.
In ATAC-seq peak calling, agents had to decide how to parameterize MACS3 correctly.
In interpretation tasks, agents had to avoid using a common literature prior when the provided files supported a different answer.
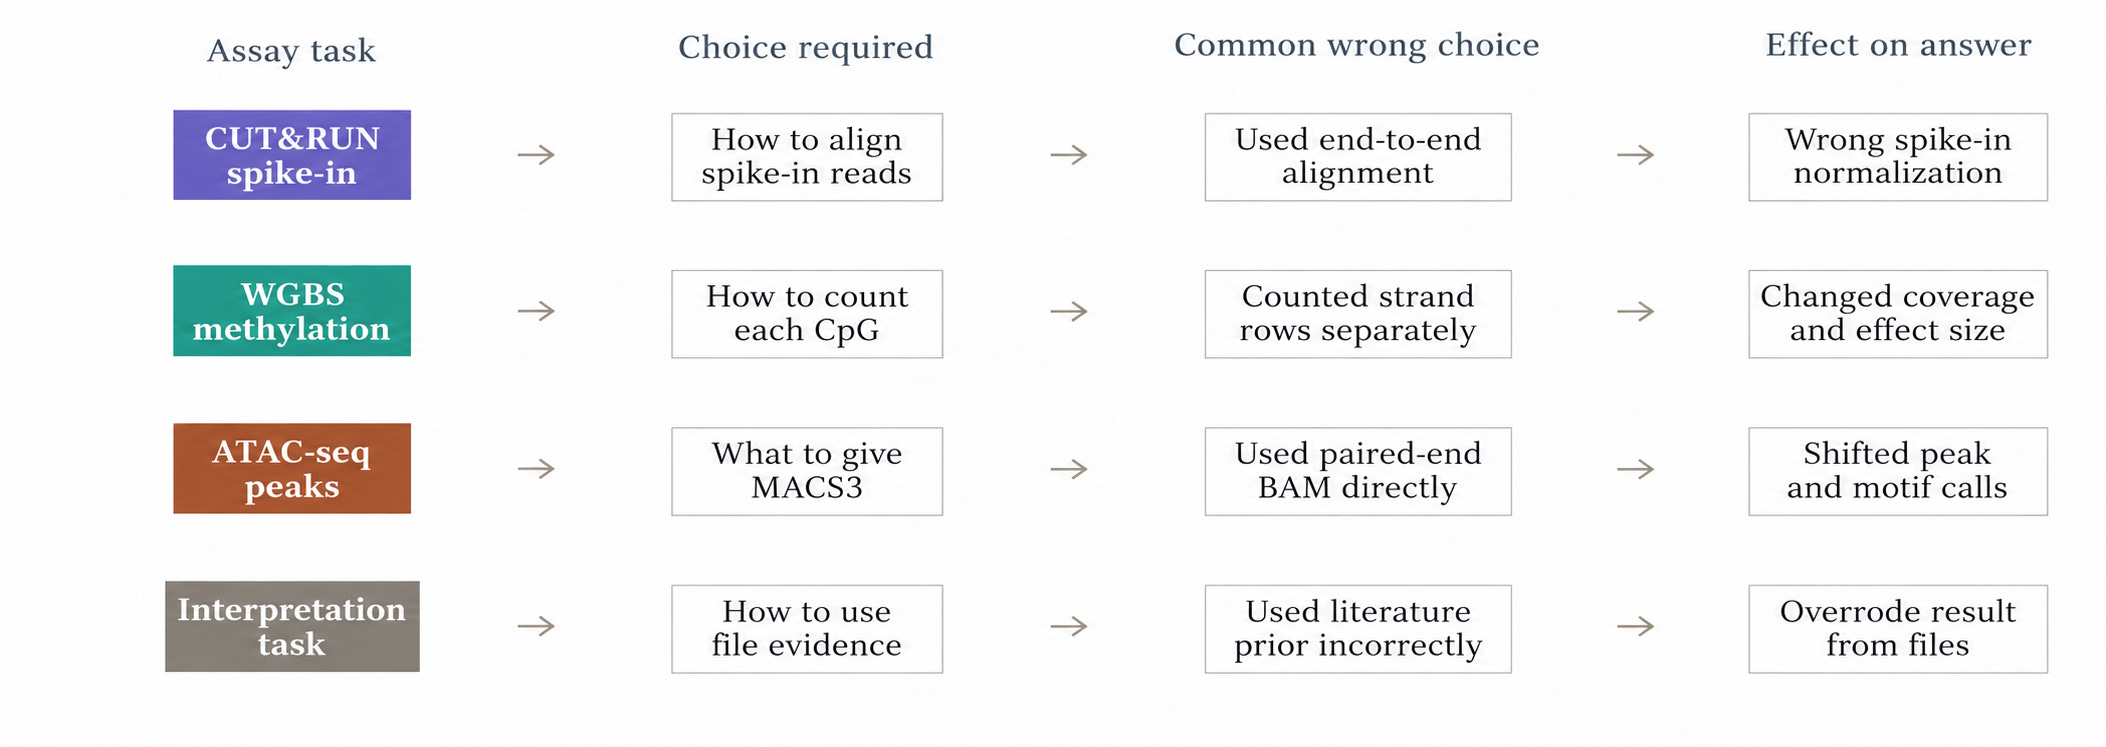
Agents often select the correct tools, read the right files, and compute useful intermediate values, but submit an answer not supported by the data associated with the task or reflect some error in scientific judgement.
Performance differs by assay type
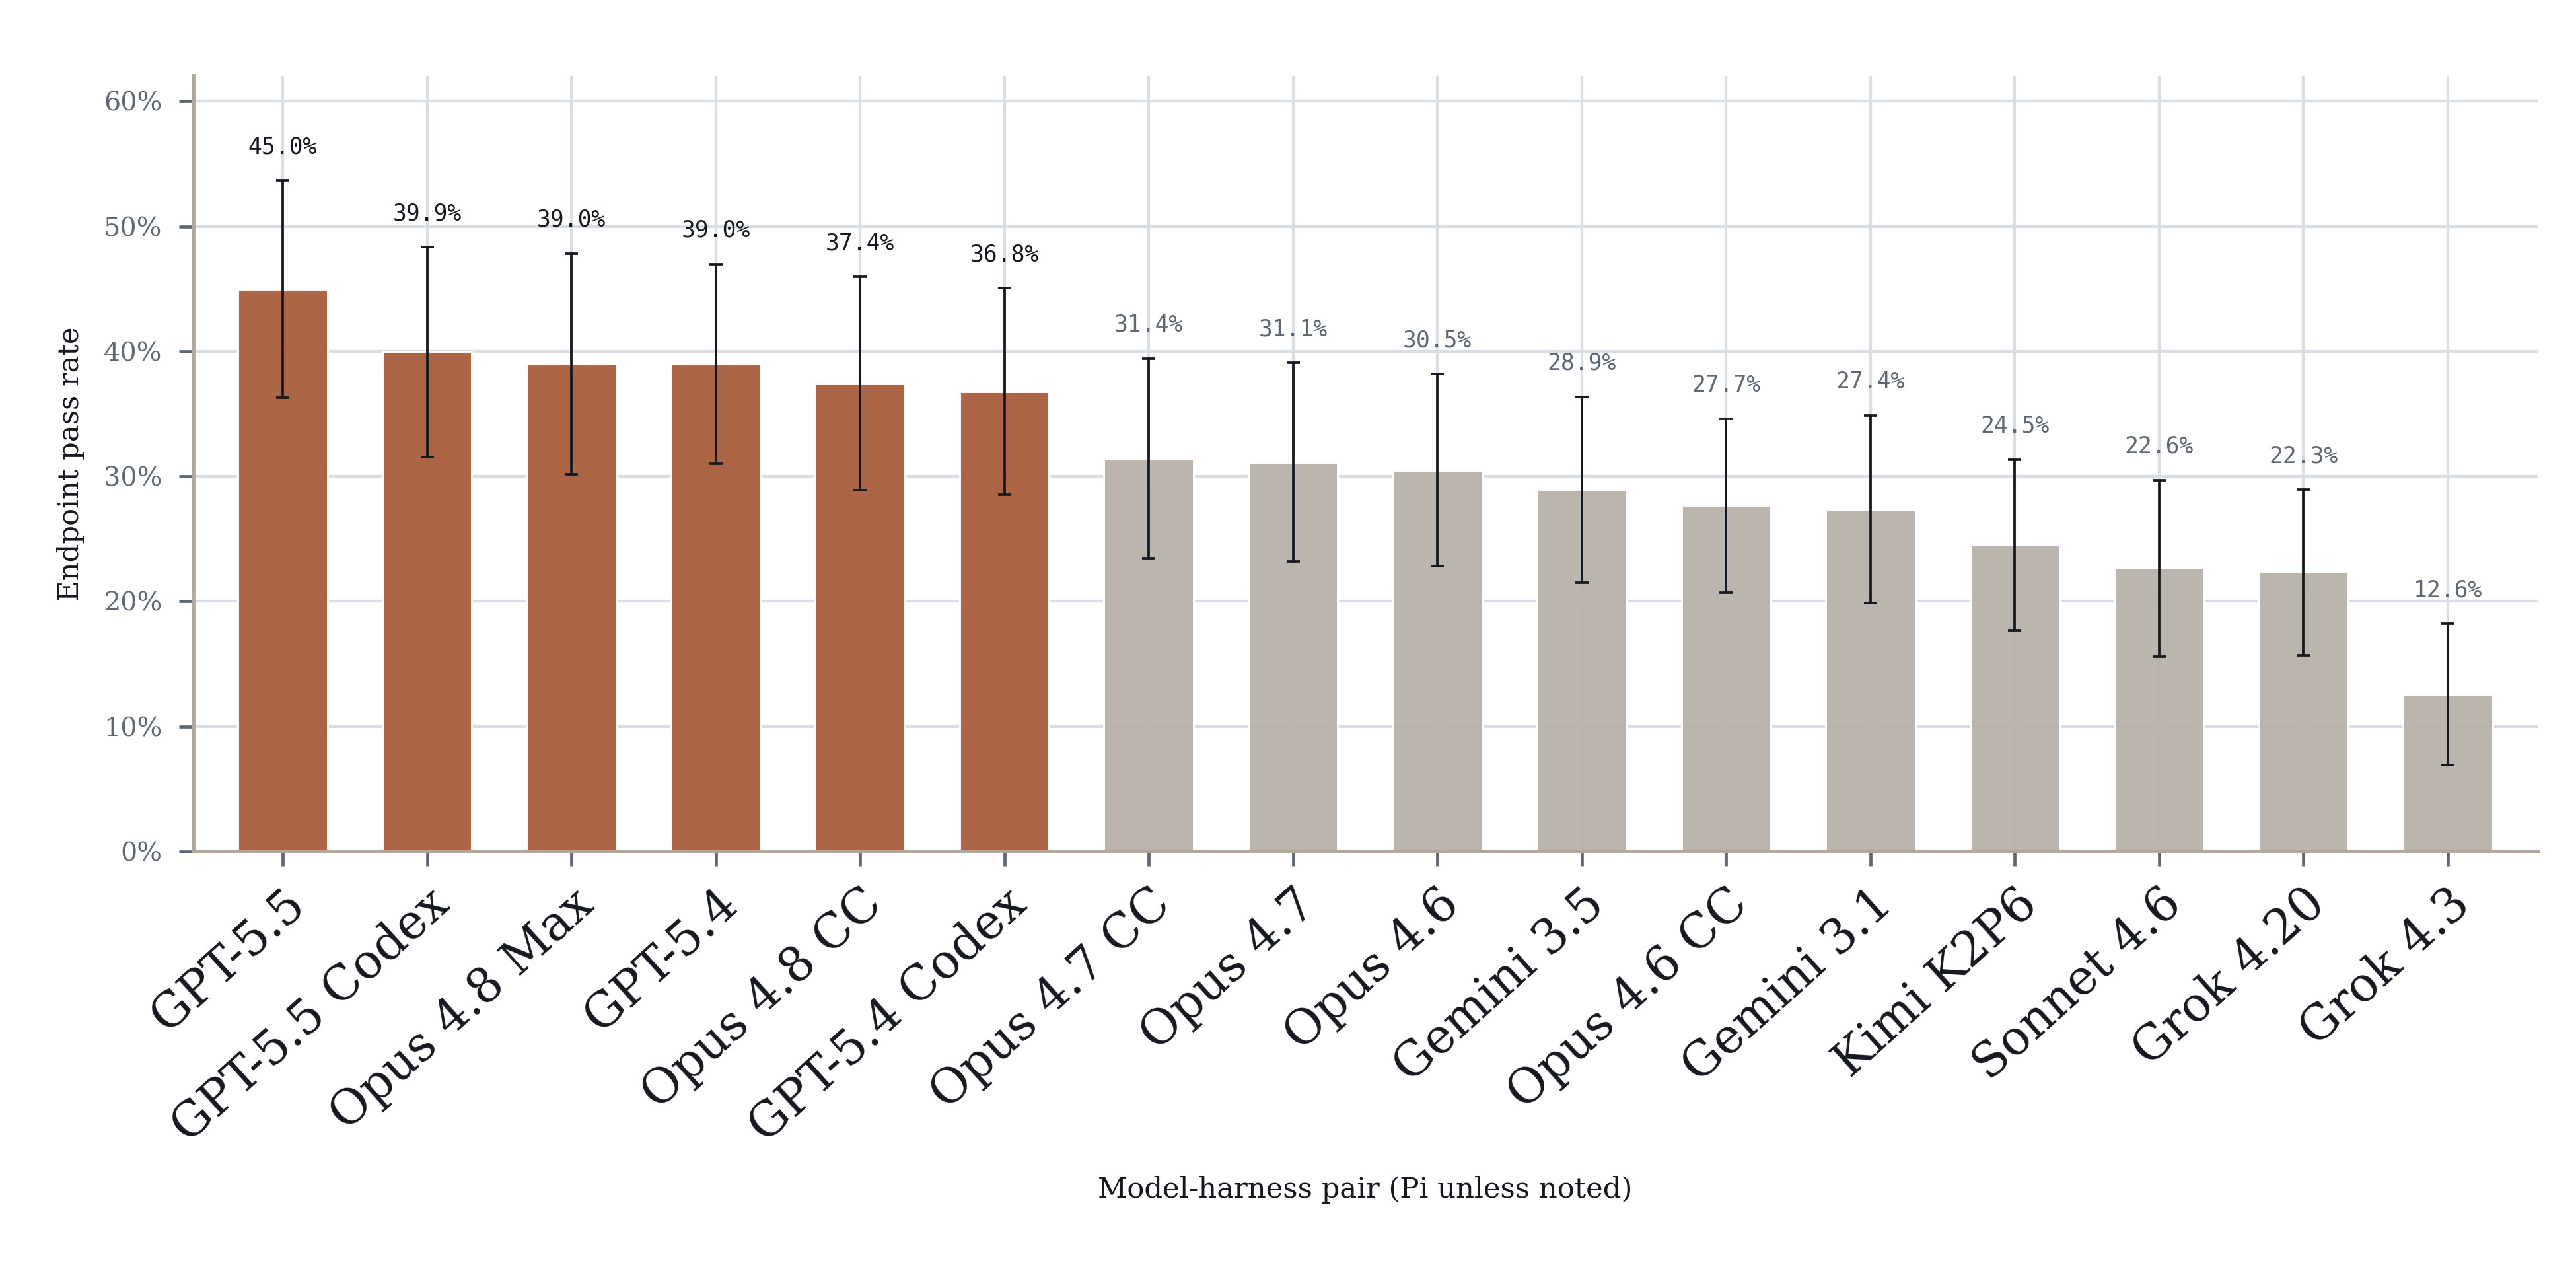
Accuracy depends in-part on the type of epigenomics data. CUT&Tag/CUT&RUN has the highest aggregate pass rate at 34.0% (768/2,256 attempts; 95% CI, 25.9-42.2), followed by methylation-seq at 33.3% (400/1,200 attempts; 95% CI, 19.7-47.0) and ChIP-seq at 30.6% (147/480 attempts; 95% CI, 9.1-52.2). ATAC-seq is lowest at 22.8% (263/1,152 attempts; 95% CI, 10.4-35.2).
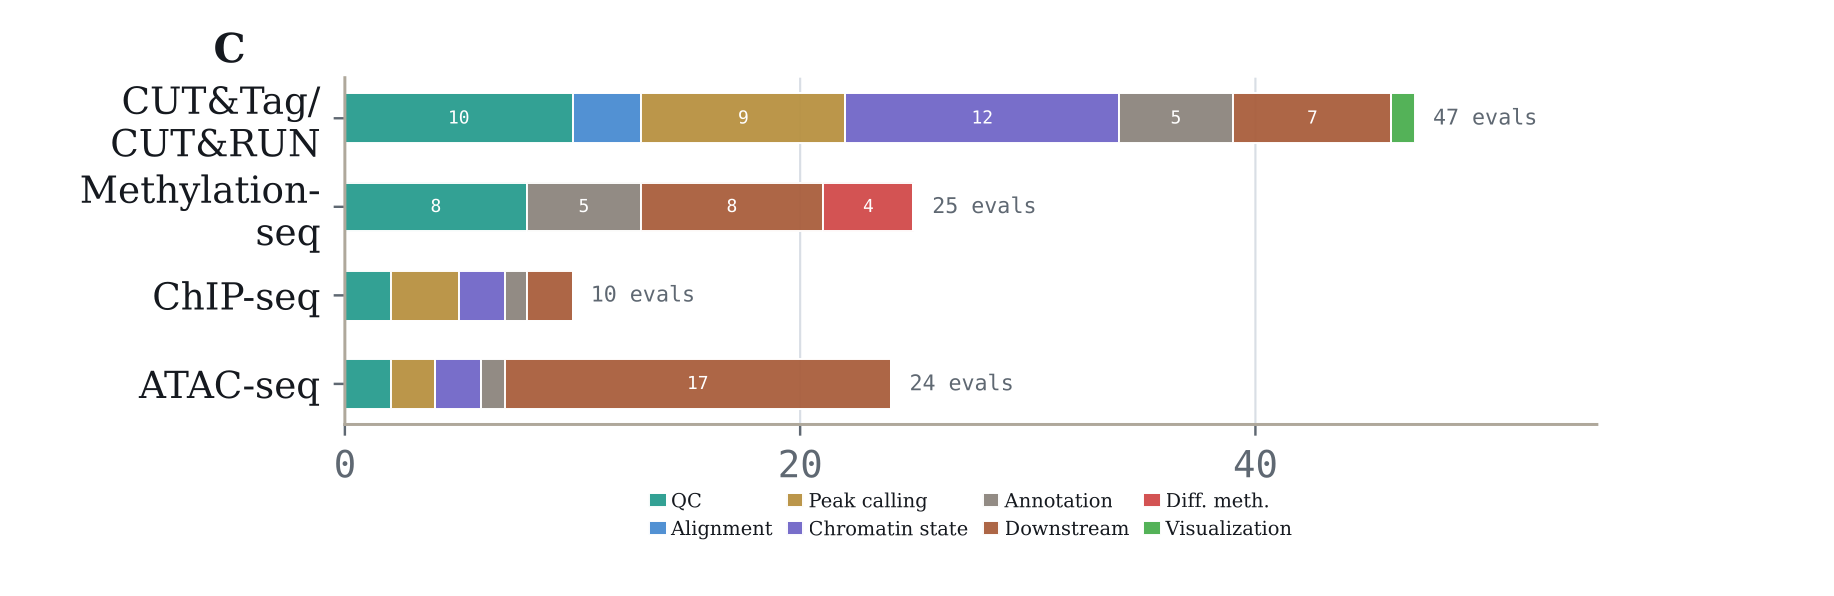
CUT&Tag/CUT&RUN contributes 47 evaluations, methylation-seq 25, ATAC-seq 24, and ChIP-seq 10, with different task mixes across QC, peak calling, annotation, chromatin-state analysis, and downstream analysis.
Read the manuscript. Explore data and trajectories
Read the manuscript for more development: latch.bio/epibench.
We regularly update our benchmark family with new models: benchmarks.bio.
Encourage those interested in understanding what these benchmarks actually measure to inspect sample tasks and trajectories