
Landscape of Imaging-based Spatial RNA Technology: Part II
A review of imaging-based spatial transcriptional assays: the history, technology tree, 9 companies + 9 products

Imaging-based spatial RNA assays are among the most powerful molecular yardsticks in biotech history, combining great ideas from microscopy and in-situ chemistry. We are in early days of this branch of assays, with new methods coming online, categories developing, technology refining.
This article is the second installment in a series investigating different “branches” of spatial technology. In part one, we took a look at sequencing-based technologies. We will focus on imaging-based methods.

This article will be organized by core concepts, methods by history and methods by attributes.
Please see this table of content to see the overall structure of the article and quickly jump to the part you’re interested in:
A Review of the Technology Tree
High-throughput spatial profiling technologies can be divided into two umbrella categories: sequencing-based and imaging-based methods. To help navigate these groups and contextualize their various branches, we’ve constructed a “technology tree”. For further exploration, we refer the reader to this online database to browse and filter technologies by different properties.

Sequencing-based methods involve strategies that ultimately use DNA sequencing to decode spatial information:
Solid-phase capture: capturing molecules on barcoded surfaces (eg. ST/Visium)
Deterministic barcoding: applying spatial barcodes directly to the tissue via microfluidics device (eg. DBiT-seq)
Photo-activated barcoding: using light to activate spatial barcoding in specific tissue regions (eg. Light-seq)

Imaging-based methods fall into two main categories:
In situ sequencing (ISS) involves hybridizing probes to target transcripts, amplifying the signal through techniques like rolling circle amplification, and then sequentially reading nucleotide sequences using iterative rounds of fluorescent labeling and imaging.
In situ hybridization (ISH), on the other hand, detects specific RNA or DNA sequences by hybridizing many fluorescently labeled probes directly to target molecules, enabling spatial localization.
This article focuses only on imaging-based, transcriptomic technologies and even then gives a cursory overview of this material. See our previous post on sequencing-based methods.
Imaging-based Methods
Core Concepts
It is useful to examine imaging technologies in comparison to Sequencing-based methods use NGS to decode spatial barcodes. Imaging-based technologies use high-resolution microscopy to directly visualize and quantify RNAs and proteins in their native tissue context.
Sequencing-based approaches excel at unbiased, whole-transcriptome profiling but can struggle with detection efficiency and sensitivity due to inefficiencies in cDNA conversion, amplification bias, and molecular dropout. In contrast, imaging-based technologies deliver higher detection efficiency and single-molecule resolution, making them superior for capturing rare transcripts and preserving spatial organization with minimal molecular loss. However, they are constrained by multiplexing limits—currently, the highest-plex imaging methods can detect up to 1,000 genes, a fraction of the ~18,000 expressed in the human genome.
To navigate the landscape, we divide imaging-based methods into three main categories:
Targeted in situ sequencing
Untargeted in situ sequencing
Fluorescence in situ hybridization (FISH)
Methods by History
Targeted In Situ Sequencing (ISS)

First ISS method introduced in 2013
The original paper for in situ sequencing in preserved cells and tissues was published in 2013 by Ke et al. The process begins by converting messenger RNA (mRNA) into complementary DNA (cDNA) using reverse transcription, followed by the degradation of the original mRNA.

A specialized padlock probe, designed to match the cDNA, hybridizes to it but leaves a small gap, which is then filled and sealed by DNA polymerase and ligase, forming a circular DNA structure. This DNA circle undergoes rolling circle amplification (RCA), generating multiple copies that create a bright fluorescent signal detectable under a microscope.
To read the genetic sequence, fluorescently labeled probes—each specific to a DNA base (A, C, G, or T)—are introduced, binding to their complementary bases. The sample is then imaged to capture the fluorescence pattern, and this process is repeated iteratively to determine the entire sequence. Computational analysis deciphers the fluorescence signals, reconstructing a spatial gene expression map that reveals how different genes are expressed within tissues.
One common disadvantage of ISS is low gene detection efficiency (likely in the order of 5%), which can be possibly attributed to low efficiency of in situ cDNA synthesis. Reverse transcription may fail to capture all mRNA molecules, leading to incomplete cDNA generation. Structural barriers in tissue, such as cross-linking in fixed samples (e.g., FFPE tissues), can hinder enzyme access to RNA.
ExSeq (2021): Reducing molecular crowding with expandable hydrogel in expansion microscopy
Targeted expansion sequencing (ExSeq) (2021 by Alon et al. at Boyden’s lab) addresses the challenges of low gene detection efficiency in traditional in situ sequencing (ISS) by integrating expansion microscopy (ExM) with ISS techniques.
The technique works by first introducing specific chemical anchors are introduced to bind RNA molecules within the tissue. This step ensures that RNA remains attached to the tissue matrix during subsequent processing. The tissue is embedded in a swellable polymer gel, typically composed of acrylamide and other monomers, permeating the tissue and linking to the anchored RNA molecules. The embedded tissue is exposed to water, causing the hydrogel to swell isotropically (equally in all directions).

This expansion physically separates the RNA molecules, enhancing their spatial resolution and accessibility for subsequent reverse transcription into complementary DNA (cDNA). The process continues with rolling circle amplification (RCA) and in situ sequencing to generate optical barcodes corresponding to the RNA identity.
Targeted ExSeq has been used to detect tens to hundreds of genes in the mouse primary visual cortex, hippocampus and human metastatic breast cancer biopsy samples, with ~40% detection efficiency.
STARmap (2018): Increasing signal-to-noise ratio and detection efficiency by removing the need for reverse transcription
STARmap is another improvement from the original in situ sequencing technique to both increase the signal-to-noise ratio and gene detection efficiency.
STARmap achieves a detection efficiency of 73%, significantly higher than earlier in situ sequencing methods (~5–10%), while profiling 160-1000 genes over six imaging cycles simultaneously. STARMAP also measured 28 genes across millimeter-scale volumes encompassing ~30,000 cells, revealing 3D patterning principles that jointly characterize a broad and diverse spectrum of cell types.
STARmap works based on four core innovations:
Targeted signal amplification with special SNAIL probe design.
Hydrogel chemistry to embed 3D tissue structure
Novel sequencing-by-ligation method called SEDAL
3D imaging
SNAIL probe hybridization - No reverse transcription: Traditional in situ sequencing relies on inefficient reverse transcription of RNA to cDNA, limiting detection sensitivity. SNAIL eliminates this step by using a primer and a padlock probe that bind adjacent RNA regions. When both attach, the padlock probe circularizes and undergoes rolling-circle amplification, forming a DNA nanoball with multiple target sequence copies.
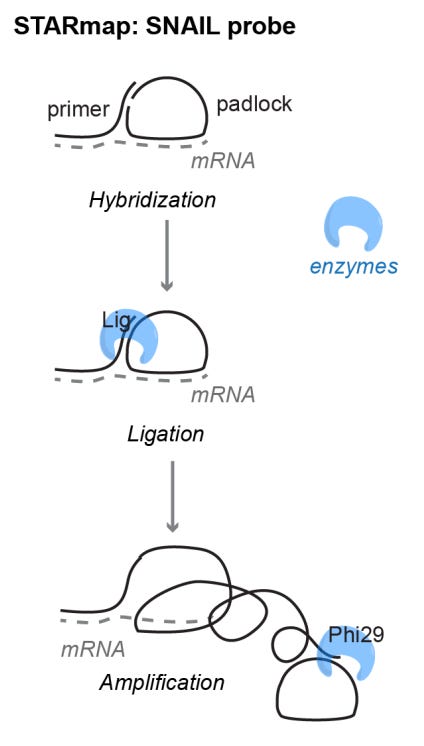
Embedding cDNAs in Hydrogel: The synthesized cDNA is embedded in a hydrogel matrix via in situ polymerization, preserving tissue architecture and immobilizing cDNA. A clearing step removes unbound molecules, enhancing optical transparency for downstream analysis.
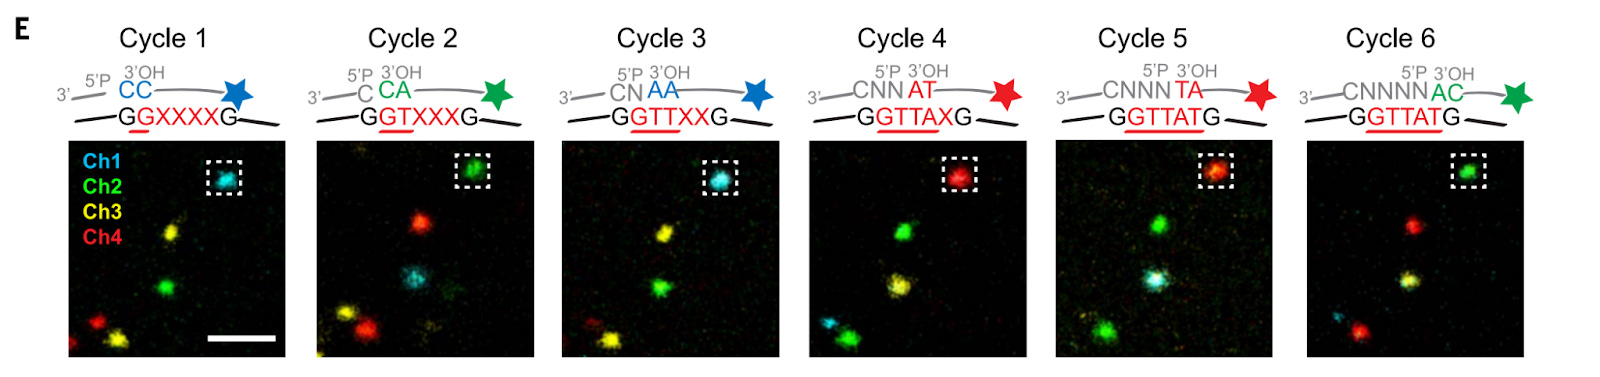
In Situ Sequencing with SEDAL: Using SEDAL (STARmap’s sequencing-by-ligation method), a reading probe binds the single-stranded DNA template. A two-base decoding system assigns fluorescent labels to specific dinucleotide sequences (e.g., AA = blue, GC = red).

After ligation, fluorescence imaging captures base identity while unligated probes are washed away. Formamide treatment strips probes while preserving DNA amplicons, allowing sequencing cycles to repeat until the entire template is read.
STARmap PLUS (2023): Enabling protein co-detection
In 2023, STARmap PLUS was published as a method that combines high-resolution spatial transcriptomics with protein detection in the same tissue section. Proteins are labeled with primary antibodies, and cDNA amplicons, antibodies, and endogenous proteins are co-polymerized in a hydrogel. Fluorescent secondary antibodies and small-molecule dyes (e.g., X-34 for Aβ plaques) visualize protein localization.
Another notable improvement is the gene-coding barcode in DNA probes was expanded from 5 to 10 nucleotides, increasing coding capacity from 1,024 to over 20,000 genes, covering the whole transcriptome.
RIBOmap (2023): Detecting actively translating mRNAs
In the same year, RIBOmap was developed, allowing for the detection of actively translating mRNAs in intact cells and tissues. Unlike STARmap, which detects all mRNA molecules, RIBOmap employs a selective tri-probe design that specifically targets and amplifies ribosome-bound mRNAs, offering insights into protein synthesis rather than just mRNA presence.
This technique can profile thousands of genes simultaneously, with studies demonstrating the ability to profile 5,413 genes in mouse brain tissue. The development of Deep-RIBOmap further extends the technique's capabilities, allowing for 3D in situ quantification of translation activities within 200-μm thick tissue blocks.
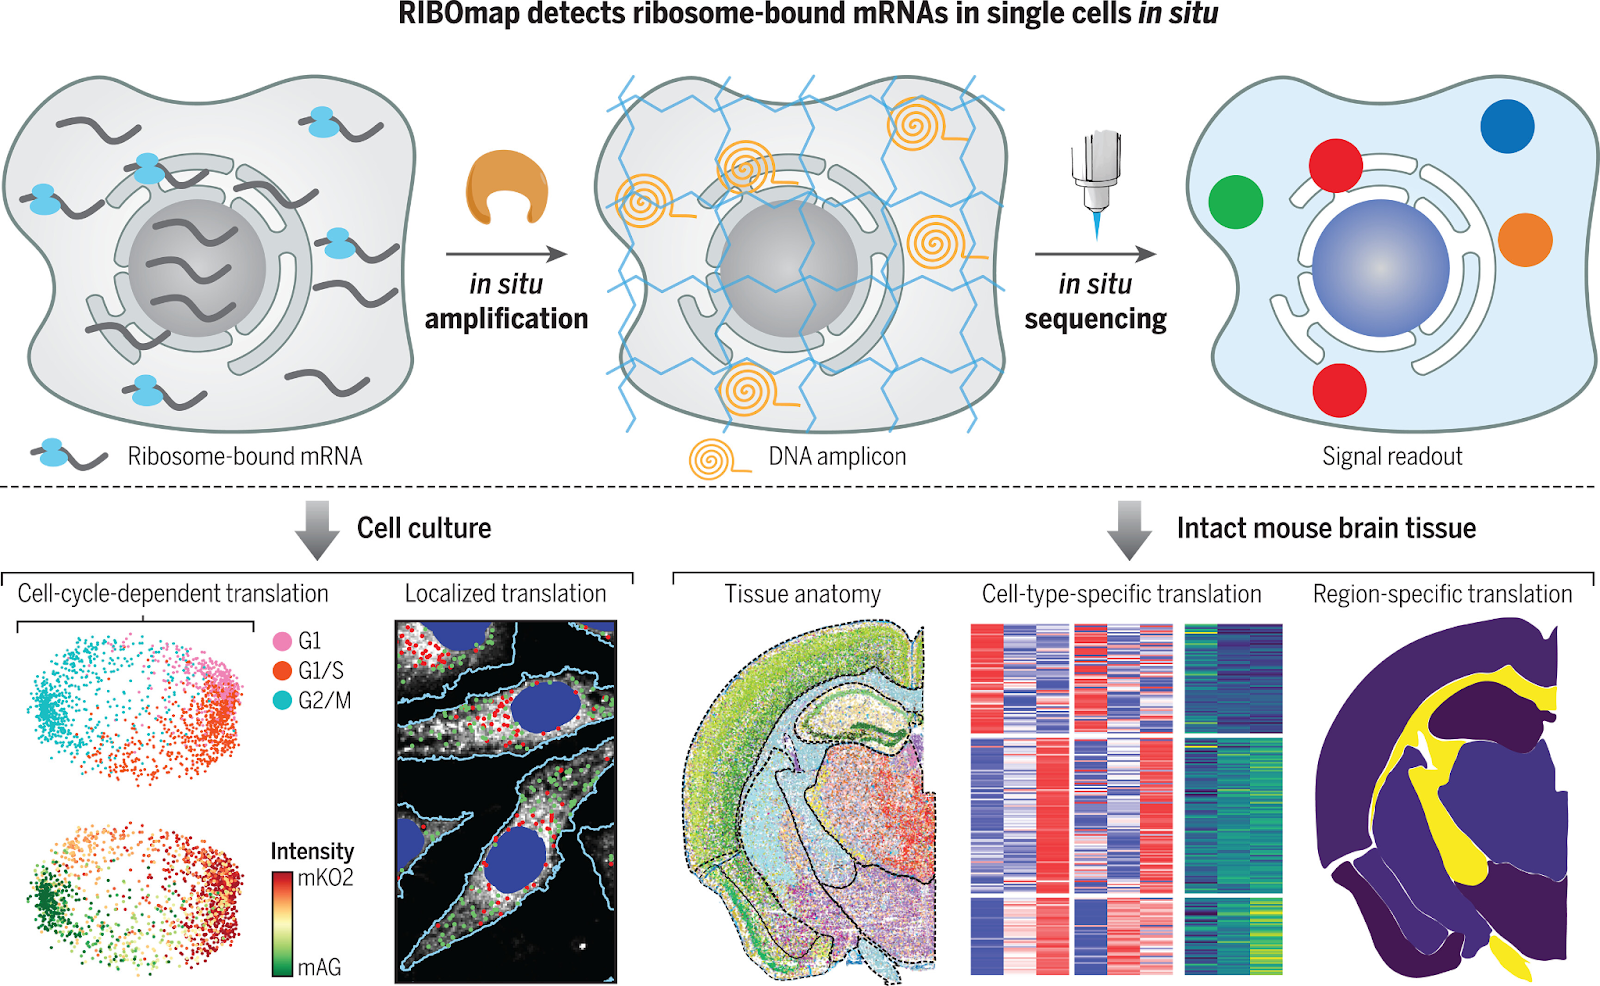
These advancements enable RIBOmap to provide more comprehensive and insightful molecular maps of protein synthesis in the context of subcellular architecture, cell types, and tissue anatomy, offering a powerful tool for understanding translational regulation in various biological contexts.
Untargeted in situ sequencing

Fluorescent In Situ Sequencing (FISSEQ) is an untargeted spatial transcriptomics method that sequences RNA while preserving its spatial context in intact cells and tissues. Unlike targeted methods that rely on pre-designed panels of gene-specific probes, FISSEQ enables transcriptome-wide analysis without predefined targets.
This is achieved by using random hexamer primers to convert all RNA molecules into complementary DNA (cDNA).
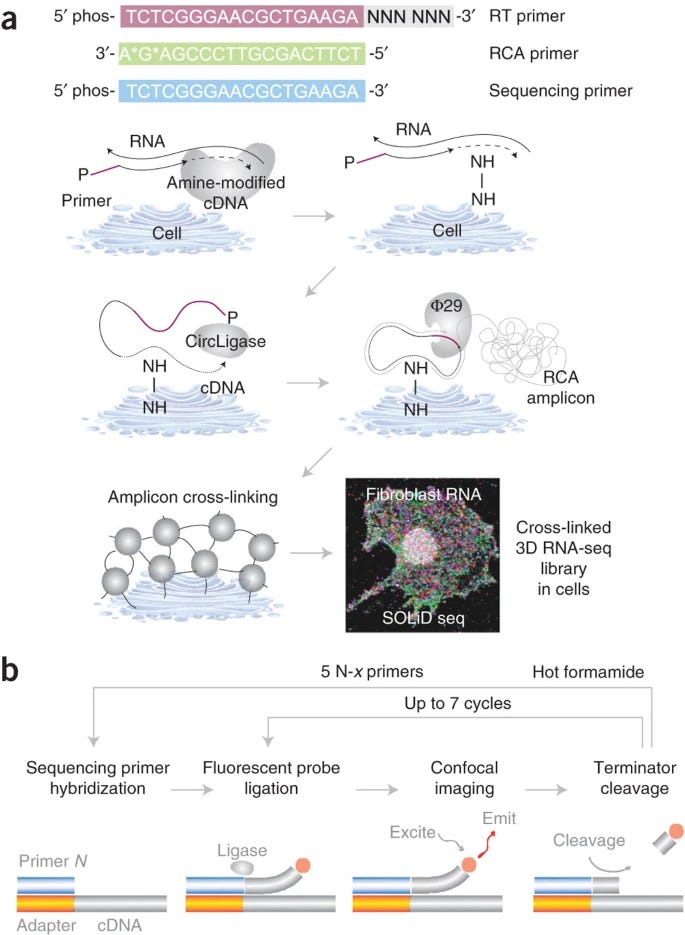
The process begins with reverse transcription (RT), where fixed cells or tissues are permeabilized, and random hexamer primers convert RNA into cDNA. The original RNA is degraded to prevent interference, and the cDNA is circularized using CircLigase. To maintain spatial localization, cDNA is cross-linked to the cellular matrix using aminoallyl-dUTP and a chemical cross-linker. RCA then generates long, repeated DNA sequences, forming a stable 3D nucleic acid matrix that can be directly sequenced.
FISSEQ uses sequencing-by-ligation (SOLiD chemistry) to read out the sequences. Fluorescently labeled dinucleotide probes are iteratively ligated to the amplicons, and a confocal microscope captures images of the fluorescence patterns. Computational analysis, including image deconvolution and base calling, reconstructs gene expression patterns across tissue sections.
The technique is highly multiplexed but has a very low gene detection efficiency (~0.01%), mainly due to inefficiencies in cDNA synthesis and RCA.
Untargeted ExSeq combines modified FISSEQ protocols with expansion microscopy to improve efficiency, resulting in improved but likely still modest detection efficiency.
Fluorescence In Situ Hybridization (FISH) methods

Single-molecule fluorescence in situ hybridization (smFISH) is a technique used to visualize and quantify individual RNA molecules within fixed cells or tissue. It relies on fluorescently labeled DNA probes that hybridize to target RNA sequences, enabling high-resolution spatial gene expression mapping. Multiple probes bind a single transcript to amplify the signal while maintaining specificity. This is unlike in situ sequencing, which employs rolling circle amplification for signal enhancement.
However, despite its precision, smFISH has historically faced two major challenges: limited multiplexing and optical crowding.
Multiplexing constraints: Traditional fluorescence microscopes can only detect a few fluorophores at once, limiting researchers to visualizing only a handful of RNA species in a single experiment. What if scientists wanted to track thousands of genes simultaneously?
Optical crowding: In densely packed cellular environments, RNA molecules can cluster so tightly that fluorescence signals overlap, making it difficult to distinguish and count individual molecules.
Beyond smFISH: How seqFISH and MERFISH Solved These Problems
To overcome multiplexing and optical crowding, researchers developed seqFISH and MERFISH, which use barcoding strategies to massively increase RNA detection without spectral overlap:
seqFISH (Sequential FISH):
Uses a temporal barcoding approach, where the same fluorophores are reused in multiple hybridization rounds. This allows for the detection of hundreds to thousands of genes in a single experiment while avoiding fluorescence spectral overlap.
MERFISH (Multiplexed Error-Robust FISH):
Uses combinatorial barcoding with built-in error correction, enabling the detection of over 10,000 different RNA species while preventing misidentification.
We will explore how each method works below.
How seqFISH Works: Expanding smFISH with Temporal Barcoding (2014)
smFISH detects RNA molecules by hybridizing fluorescently labeled probes to their target sequences. Each gene typically requires a unique fluorophore, which limits the number of RNAs that can be simultaneously visualized to the number of spectrally distinct dyes available (~3-5).
On the other hand, instead of using a distinct fluorophore for each gene, seqFISH reuses a small set of fluorophores across multiple imaging cycles, allowing for the detection of thousands of RNA species in a single experiment.
In each round, target RNA molecules are hybridized with FISH probes carrying a single fluorophore (e.g., red, blue, or green).
The sample is imaged to capture the fluorescent signals.
DNase I is used to digest the FISH probes, removing them from the sample.
The same RNA molecules are then hybridized with a new set of probes, now labeled with different fluorophores. This process repeats iteratively over multiple rounds, generating a unique temporal barcode for each RNA species.

Barcoding Example:
To see how seqFISH generates a vast number of barcodes for thousands of genes, let us consider a temporal barcoding example.
The number of uniquely encoded RNA species follows an exponential scaling law:
Total Barcodes = F^N
where:
F is the number of fluorophores,
N is the number of hybridization rounds.
For example, if we use 3 fluorophores (red, blue, green) and perform 2 hybridization rounds, we can encode 3² = 9 unique RNA species with the following barcode combinations:
RR (Red in round 1, Red in round 2)
BR (Blue in round 1, Red in round 2)
GR (Green in round 1, Red in round 2)
RB (Red in round 1, Blue in round 2)
BB (Blue in round 1, Blue in round 2)
GB (Green in round 1, Blue in round 2)
RG (Red in round 1, Green in round 2)
BG (Blue in round 1, Green in round 2)
GG (Green in round 1, Green in round 2)
Scaling this further, with 4 fluorophores and 8 hybridization rounds, we can encode 4⁸ = 65,536 RNA species, covering the entire transcriptome.
seqFISH+ (2019)
seqFISH+ builds on seqFISH by introducing an improved probe design and workflow that significantly increases multiplexing capacity and imaging resolution.
How does seqFISH+ probe design increase its multiplexing capacity?
Each primary probe in seqFISH+ consists of:
mRNA-complementary sequence (28–30 nucleotides):
Targets specific regions of the mRNA for precise hybridization.
Designed to avoid off-target binding by optimizing GC content and sequence specificity.
Barcode regions (4 regions, each 20 nucleotides):
Serve as binding sites for fluorescently labeled readout probes during imaging.
Each barcode region corresponds to one barcoding round.
Spacer sequences (2 nucleotides):
Separate barcode regions to prevent structural interference during hybridization.
Flanking primer sequences:
Used for amplification during probe synthesis.
Each gene is targeted by 24 primary probes, which ensures robust signal amplification and redundancy for accurate detection.
The structure of each barcode can look like the following:
5’ Primer – Barcode Region R1 (20nt) – 2nt spacer – Barcode Region R2 (20nt) – 2nt spacer – Barcode Region R3 (20nt) – 2nt spacer – Barcode Region R4 (20nt) – 3’ Primer
Barcoding Strategy

Imaging is performed using three fluorescent channels (e.g., Alexa Fluor 488, Cy3b, and Alexa Fluor 647), with each channel capable of encoding up to 8,000 genes.
Within each channel, the barcoding process consists of four rounds. Each barcoding round includes 20 hybridization cycles, where readout probes bind to the overhang sequences of the primary probes. These hybridization events generate a unique identifier between 1 and 20, referred to as a ‘pseudocolor’—a numerical code that represents the hybridization state rather than a physical color. In other words, n (n=20 for example) pseudocolours can be thought of as n-bit barcodes in which only one bit contains a ‘1’.
In simple terms, each barcoding round produces one pseudocolor. With three barcoding rounds, the number of possible barcodes is 20 × 20 × 20 = 8,000, allowing for the detection of 8,000 unique genes per channel. The authors implemented a fourth barcoding round, primarily for error correction.
Since each fluorescent channel can encode 8,000 genes, using three channels enables the detection of 24,000 genes in total.
Since imaging time is the primary bottleneck in spatial transcriptomics, seqFISH+ achieves an eightfold speed increase compared to seqFISH with expansion microscopy. In seqFISH, detecting 16,384 genes requires four fluorescent channels, eight barcoding rounds, and a 60-fold sample expansion, resulting in 1,920 images per field of view (FOV). In contrast, seqFISH+ encodes genes using 60 pseudocolors across four barcoding rounds, reducing the imaging requirement to 240 images per FOV while detecting 24,000 genes—dramatically cutting imaging time. Additionally, the use of more pseudocolors and a shorter four-round barcode helps minimize accumulated errors over multiple barcoding cycles.
MERFISH (2015): Multiplexed Error-Robust Fluorescence In Situ Hybridization
Multiplexed Error-Robust Fluorescence In Situ Hybridization (MERFISH) is a powerful spatial transcriptomics technique that enables the detection of thousands of RNA species at single-molecule resolution. It builds on smFISH but overcomes its limitations by using a combinatorial binary barcoding system with built-in error correction, allowing for highly multiplexed and accurate RNA imaging.
The core idea of MERFISH: Instead of giving each gene a unique fluorophore, it assigns each RNA molecule a binary barcode (sequence of zeros and ones) that is read out over multiple imaging cycles.

In the first imaging round, fluorescent probes are introduced to tissue samples. Any RNA molecules that bind with the probe are assigned the barcode digit 1 for “ON”. Unbound mRNAs are assigned digit 0 for “OFF”. After imaging, the probes are removed and replaced with a new set for the next hybridization round. This process repeats for N imaging rounds, with each round contributing one bit to the barcode. At the end of the experiment, the fluorescence patterns across all rounds are compiled to reconstruct the binary barcode for each RNA molecule. Computational algorithms match the observed barcodes to a predefined gene library, identifying thousands of RNA species with high accuracy.
Barcoding Example
If an experiment uses 4 imaging rounds, each RNA species gets a 4-bit barcode, like:
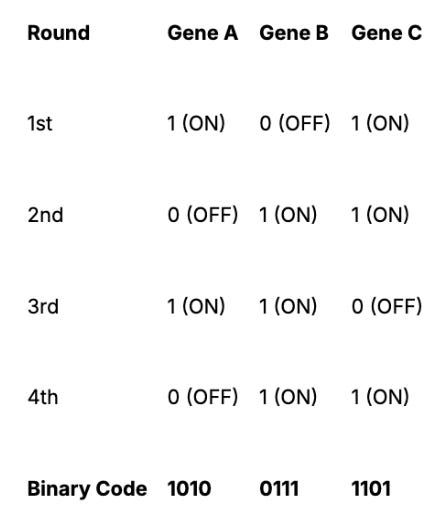
Using this approach, with 16 imaging rounds, MERFISH can encode up to 2¹⁶ = 65,536 unique RNA species. With built-in error correction, it can robustly detect 10,000–20,000 genes per experiment, far beyond smFISH or even seqFISH.
Methods by Properties
Based on the original in situ sequencing, smFISH, seqFISH(+), and MERFISH technologies, 9 products have been commercialized on the market.
Imaging-based spatial transcriptomics technologies provide subcellular resolution and enable highly multiplexed RNA detection directly within preserved tissue sections. While most platforms support FFPE and fresh frozen tissues, they differ in customizability, multiomic capabilities, throughput, specificity, and sensitivity, influencing their suitability for different research applications.
Below, we compare major platforms from 10X Genomics, NanoString (Bruker), Vizgen, Resolve Biosciences, Acuity Spatial, Biotechne, Spatial Genomics, Stellaromics, and RebusBio.
Gene Panels: Customizability & Scale
The number of genes each platform can profile varies significantly.
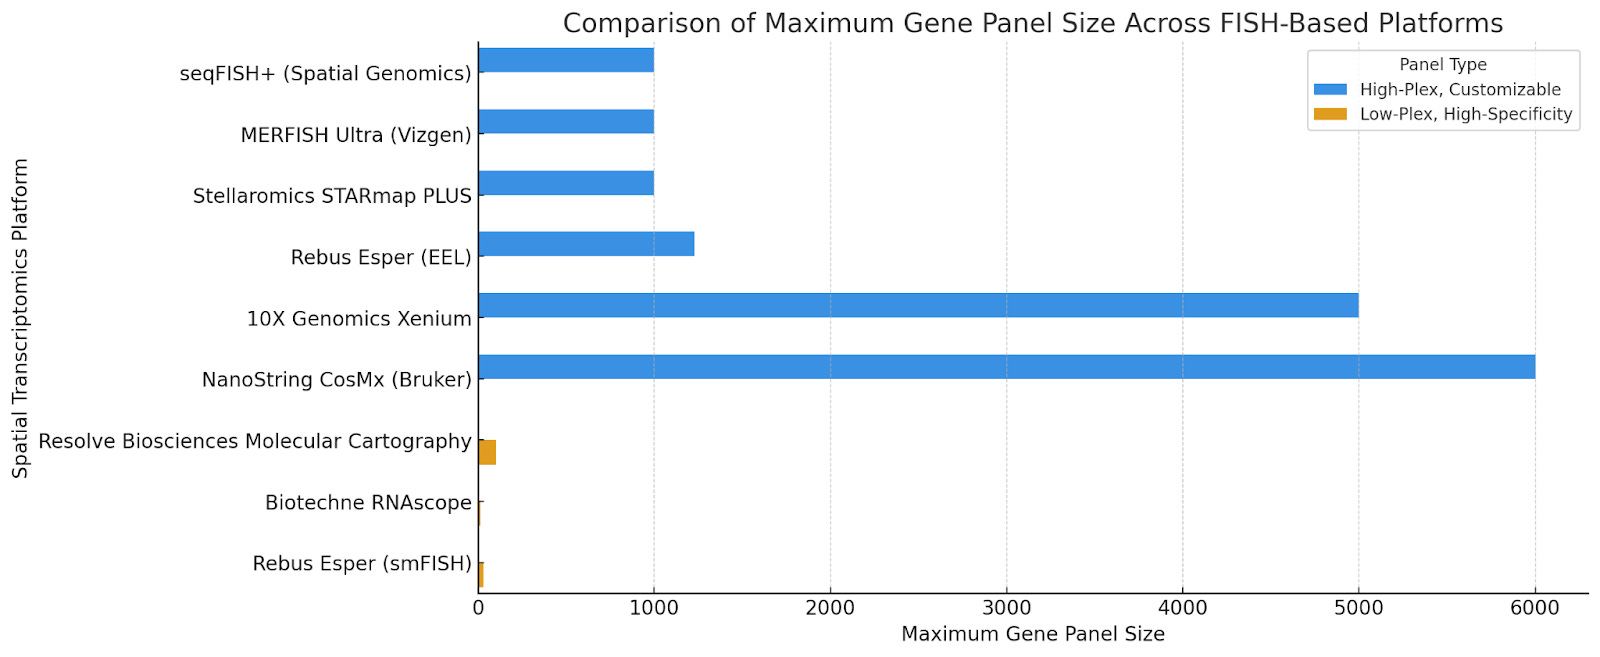
High-Plex, Customizable Panels:
seqFISH+ (Spatial Genomics): 100-1,000 genes
MERFISH Ultra (Vizgen): 100-1,000 genes
Stellaromics: Demonstrated >1,000 genes in intact mouse brain sample with STARmap PLUS.
Rebus Esper with EEL FISH: 1,230 genes
10X Genomics Xenium: 480 to 5,000 genes
NanoString CosMx (Bruker): Up to 6,000 genes
Low-plex, customizable, and optimized gene panels for high specificity:
Resolve Biosciences Molecular Cartography: ~100 genes
Biotechne RNAscope: ~12 genes
Rebus Esper with smFISH: Up to 30 genes
Platforms with customizable panels allow for discovery-based studies where researchers need to detect thousands of genes across tissue sections. Fixed panels, on the other hand, are optimized for high sensitivity and specificity, making them ideal for biomarker validation and targeted studies.
Throughput – Imaging Area Per Week

*Note that data was not provided in other company websites and therefore not included in the graph. Please reach out to individual companies to understand their throughput.
In spatial transcriptomics, throughput—the capture-able image area per week—varies significantly across platforms, each offering distinct advantages and trade-offs. NanoString's CosMx leads with a throughput of 7,800 mm² per week, making it ideal for large-scale tissue studies where extensive spatial coverage is essential. However, higher throughput often comes at the expense of detection sensitivity.
Conversely, platforms like Resolve Biosciences' Molecular Cartography, with a throughput of 52 mm² per week, prioritize high spatial resolution and specificity, enabling detailed analysis of gene expression at the single-cell level. The trade-off here is a reduced capacity to process large tissue areas within the same timeframe.
10X Genomics' Xenium and Vizgen's MERFISH Ultra offer intermediate throughputs of 1,400 mm² and 900 mm² per week, respectively, balancing spatial coverage with resolution and sensitivity. These platforms are suitable for studies requiring a moderate tissue area analysis without compromising on cellular detail.
Tissue Types Profiled: Beyond FFPE & Fresh Frozen
Most FISH-based technologies work with FFPE and fresh frozen tissues, ensuring compatibility with archival pathology samples and clinical studies. However, some platforms support additional sample types:
One distinctive feature of Vizgen’s Merscope and MERFISH Ultra is its capability to profile cultured cells, enabling the examination of spatial intracellular signaling in complex cell cultures such as 3D structures or organoids. Similarly, Stellaromics’ Pyxa platform allows detecting 1,000 transcripts on intact 100-200 micron 3D tissue structure. These capabilities are critical for researchers studying intracellular signaling, stem cell differentiation, and developmental biology.
Multiomic Capabilities: RNA & Protein Profiling
Some platforms enable simultaneous RNA and protein detection, while others focus solely on RNA. Current platforms that provide co-detection include:
NanoString CosMx (Bruker) (Detection in a sequential workflow) – Up to 64 proteins
MERFISH Ultra (Vizgen) (Simultaneous RNA and protein profiling on the same tissue section) – Up to 6 proteins
Biotechne RNAscope Multiomic LS assay – Up to 6 proteins
Spatial Genomics GenePS – Offers sequential immunofluorescence for protein detection, but number of proteins unspecified.
Multiomic capabilities are valuable in immuno-oncology, tumor microenvironment studies, and spatial proteomics, where linking gene expression to protein localization is crucial.
Sensitivity
Hartman and Satija (2024) conducted a comparative benchmarking analysis of six multiplexed in situ gene expression profiling technologies using publicly available mouse brain datasets.
Among the technologies analyzed, Vizgen’s MERSCOPE exhibited the best balance of sensitivity and specificity, both in its published output and after re-segmentation. MERSCOPE achieved this performance with a large panel of 483 genes, demonstrating that high specificity does not necessarily come at the expense of panel size. 10x Genomics’ Xenium also performed well but used more lenient segmentation boundaries, leading to a higher number of detected molecules per cell but also a significant increase in incorrect molecular assignments.
Resolve Biosciences’ Molecular Cartography and MERFISH showed similar sensitivity, despite having vastly different panel sizes. Molecular Cartography, with only 99 genes, demonstrated strong per-gene sensitivity, whereas MERFISH, with the largest panel (1147 genes), showed that high sensitivity can be maintained even with high plexity. EEL FISH, in contrast, had the lowest sensitivity of all platforms, a well-known tradeoff attributed to its design, which prioritizes fast imaging and reduced autofluorescence by electrophoretically transferring mRNA transcripts to a secondary slide.
Another study by Wang et. al (2023) compared the performance of various in situ imaging technologies in FFPE tissues and tumor microarrays (TMAs). The authors discovered that Xenium had the highest sensitivity across tissues. CosMx and MERSCOPE both detected fewer transcripts than Xenium. MERSCOPE outperformed CosMx in the higher quality (as judged by relative performance across tumor TMA but underperformed it in lower quality normal tissue TMA.
Focusing on performances in FFPE tissue, another study by Cook et. al (2023). They generated spatial transcriptomics data from serial sections of prostate adenocarcinoma using the 10x Genomics Xenium and NanoString CosMx SMI platforms. Additionally, orthogonal single-nucleus RNA sequencing (snRNA-seq) was performed on the same FFPE tissue to establish a reference for the tumor’s transcriptional profiles. The author concluded that although fewer genes are measured (CosMx: 960, Xenium: 377, with an overlap of 125), Xenium consistently demonstrates higher sensitivity, a broader dynamic range, and better alignment with single-cell reference profiles. Conversely, CosMx’s out-of-the-box segmentation outperformed Xenium’s, resulting in noticeable transcript misassignment in Xenium within certain tissue areas. However, the impact of this on the cells’ transcriptional profile was minimal.
Specificity: Accuracy of Gene Detection
Specificity refers to how well a platform correctly identifies closely related RNA sequences while minimizing off-target signals. The study by Wang et. al (2023) demonstrated that Xenium and Merscope demonstrate superior specificity compared to CosMx in FFPE tissues for tumor microenvironments, while CosMx enables detection of larger gene panels.
For applications requiring single-nucleotide specificity (e.g., distinguishing splice isoforms or SNP variants), platforms with error correction and high specificity are better options.
Species
If working with non-human or non-mouse samples, viable options are Vizgen’s MERFISH Ultra, Resolve Biosciences’ Molecular Cartography, and Rebus Esper. While many companies offer custom gene panel design, the cost can be significant due to the extensive optimization required to ensure panel performance.
Future developments
Higher plexity towards whole transcriptome
Today, no imaging-based method can unbiasedly profile the whole transcriptome with high sensitivity. While multimodal measurements are possible, further advances in multiplexing across all modalities could enable spatially resolved, genome-wide measurements at cellular resolution. This, in turn, would allow the generation of single-cell phenotype atlases with spatial context from a single experiment.
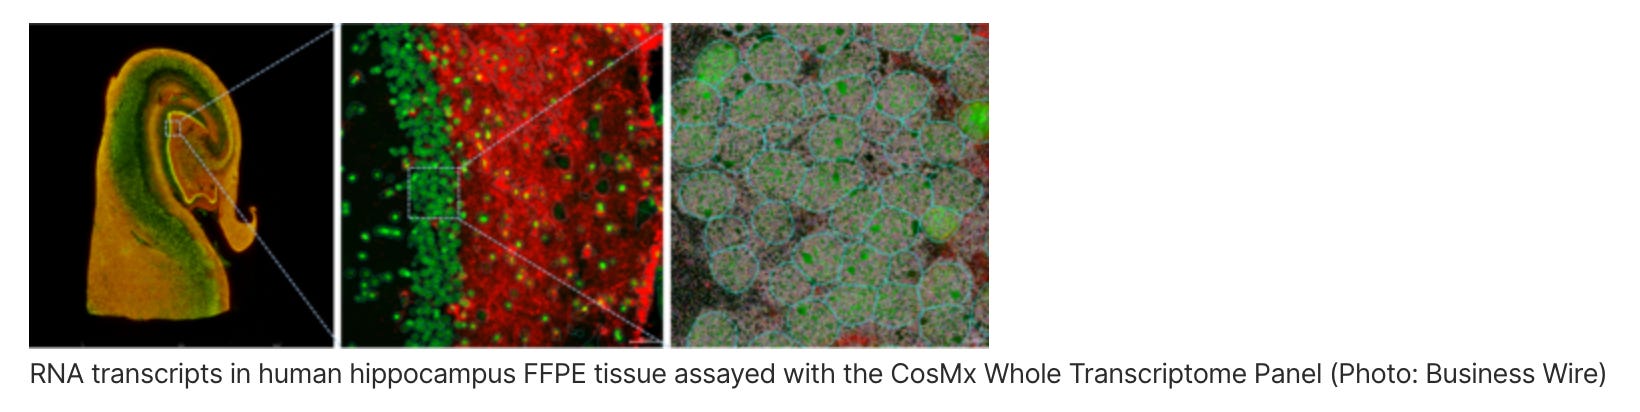
Leading this trend, Nanostring announced at AGBT 2025 that its Human Whole Transcriptome Panel will launch in April, with commercial shipments expected this summer. A Mouse Whole Transcriptome Panel is slated for release later in 2025.
Live-cell imaging
Most existing methods focus on fixed cells, limiting the ability to capture dynamic gene expression changes in live-cell contexts. Advances in live-cell imaging and real-time transcriptomic profiling will be important to fully understanding cellular behavior in native environments.
3D atlas construction
Additionally, as the vast majority of tissues are three-dimensional structures, improving spatial profiling methods, whether through serial 2D sections or true 3D imaging, will enable the construction of comprehensive 3D atlases of cells and tissues. However, integrating these datasets across multiple modalities and length scales requires novel computational methods capable of harmonizing high-dimensional spatial and molecular data.
Unified ecosystem of verified computational tools
Standardization in computational pipelines remains a major challenge. Currently, no unified ecosystem exists for imaging-based spatial transcriptomics across the dozens of platforms available. While instrument-provided image segmentation software represents a step forward, it is insufficient for extracting meaningful biological insights. Scientists may want to re-analyze terabytes of imaging data alongside gene expression profiles but lack the necessary computational infrastructure without sophisticated cloud setups.
Many critical questions often arise downstream: How do ligand-receptor interactions vary across different tissue microenvironments? Can users dynamically select and refine spatial clusters for downstream analysis? How can spatial and transcriptomic data be integrated with other omics layers to generate a more complete picture of cellular function? One cannot underestimate the necessity of intuitive and well-designed user interfaces that empower scientists to interact with and interpret their data easily. Thoughtful curation of these tools, combined with an emphasis on accessibility and delightful user experience, will be key to unlocking deep insights from large-scale spatial projects.
Cool, I wrote something like this but not as comprehensive a while back https://open.substack.com/pub/weeklybioinformatics/p/peering-through-the-tissues-1?utm_source=share&utm_medium=android&r=1nz9t4
Pretty comprehensive! But I think you are starting in the wrong end. Either go with what the clinic or pharma needs. Or look at at from an RNA perspective. Both approaches should converge on the percentage true/false positive signals, and true/false negative signals. Reliable data is the only thing the FDA will let through.
As example real single molecule RNA FISH - marketed as Stellaris RNA FISH by LGC Biosearch Tech - not the same as BioTechne/ACD RNAScope or ThermoFisher/eBioscience tree building RNA detection systems. The former uses non-signal amplification by laying our many singly labeled probes, the latter grows a couple of large DNA trees on top of the cellular RNA. The signals from the different modalities do not result in the same the percentage true/false positive signals, and true/false negative signals.
It would be very interesting to see what the percentages are for the others’.