


Nervous system disorders and diseases such as Alzheimer’s disease, autism, and neuropathic pain, among many others, are a leading cause of disability worldwide and a key driver of medical expense. As of 2025 they affected more than 40% of the global population (WHO), yet new treatments remain scarce. In the world of pharmacology, only 5.9% of neurological and 7.3% of psychiatric drug programs that enter Phase 1 reach approval, below the 7.9% average across all indications (BIO). Many of these failures trace back to gaps in our understanding of neurobiology. Translation is impacted by both cell-based assays and animal models that poorly recapitulate human disease, therapeutic mechanisms that can’t produce a large enough effect on the disease state, and improper selection of endpoints that miss patient heterogeneity.
Yet in 2026 there is not a shortage of available neuroscience data. Brain-wide single cell atlases, connectomes, biobanks, population imaging studies and electrophysiology archives have grown enormously. The bottleneck has moved from generating data to analyzing and interpreting it. A neuroscientist publishing a multimodal study must succeed in choosing the right unit of analysis, catching artifacts, and knowing when a correlation isn’t a cause. The potential for AI agents here is clear, however, neuroscientists must first understand the strengths and weakness of frontier models in analyzing and interpreting real world data.
Existing benchmarks excel at testing recall, but do not focus as much on interpretation. Benchmarks such as BrainBench showed that language models beat human experts at picking which version of an abstract reports a study’s real result (Luo et al., 2025), but that measures what a model has read, not whether it can analyze new data. To address this, we built NeuroscienceBench, consisting of 91 evaluations drawn from 43 peer-reviewed studies. Across these evaluations, agents receive the same data a neuroscientist would and have to return a structured answer that is deterministically graded. Each evaluation is run in triplicate across every model configuration, with the highest pass rate below 33%. It follows the same design as our earlier benchmarks, most recently including RareDiseaseBench.
Tl;dr
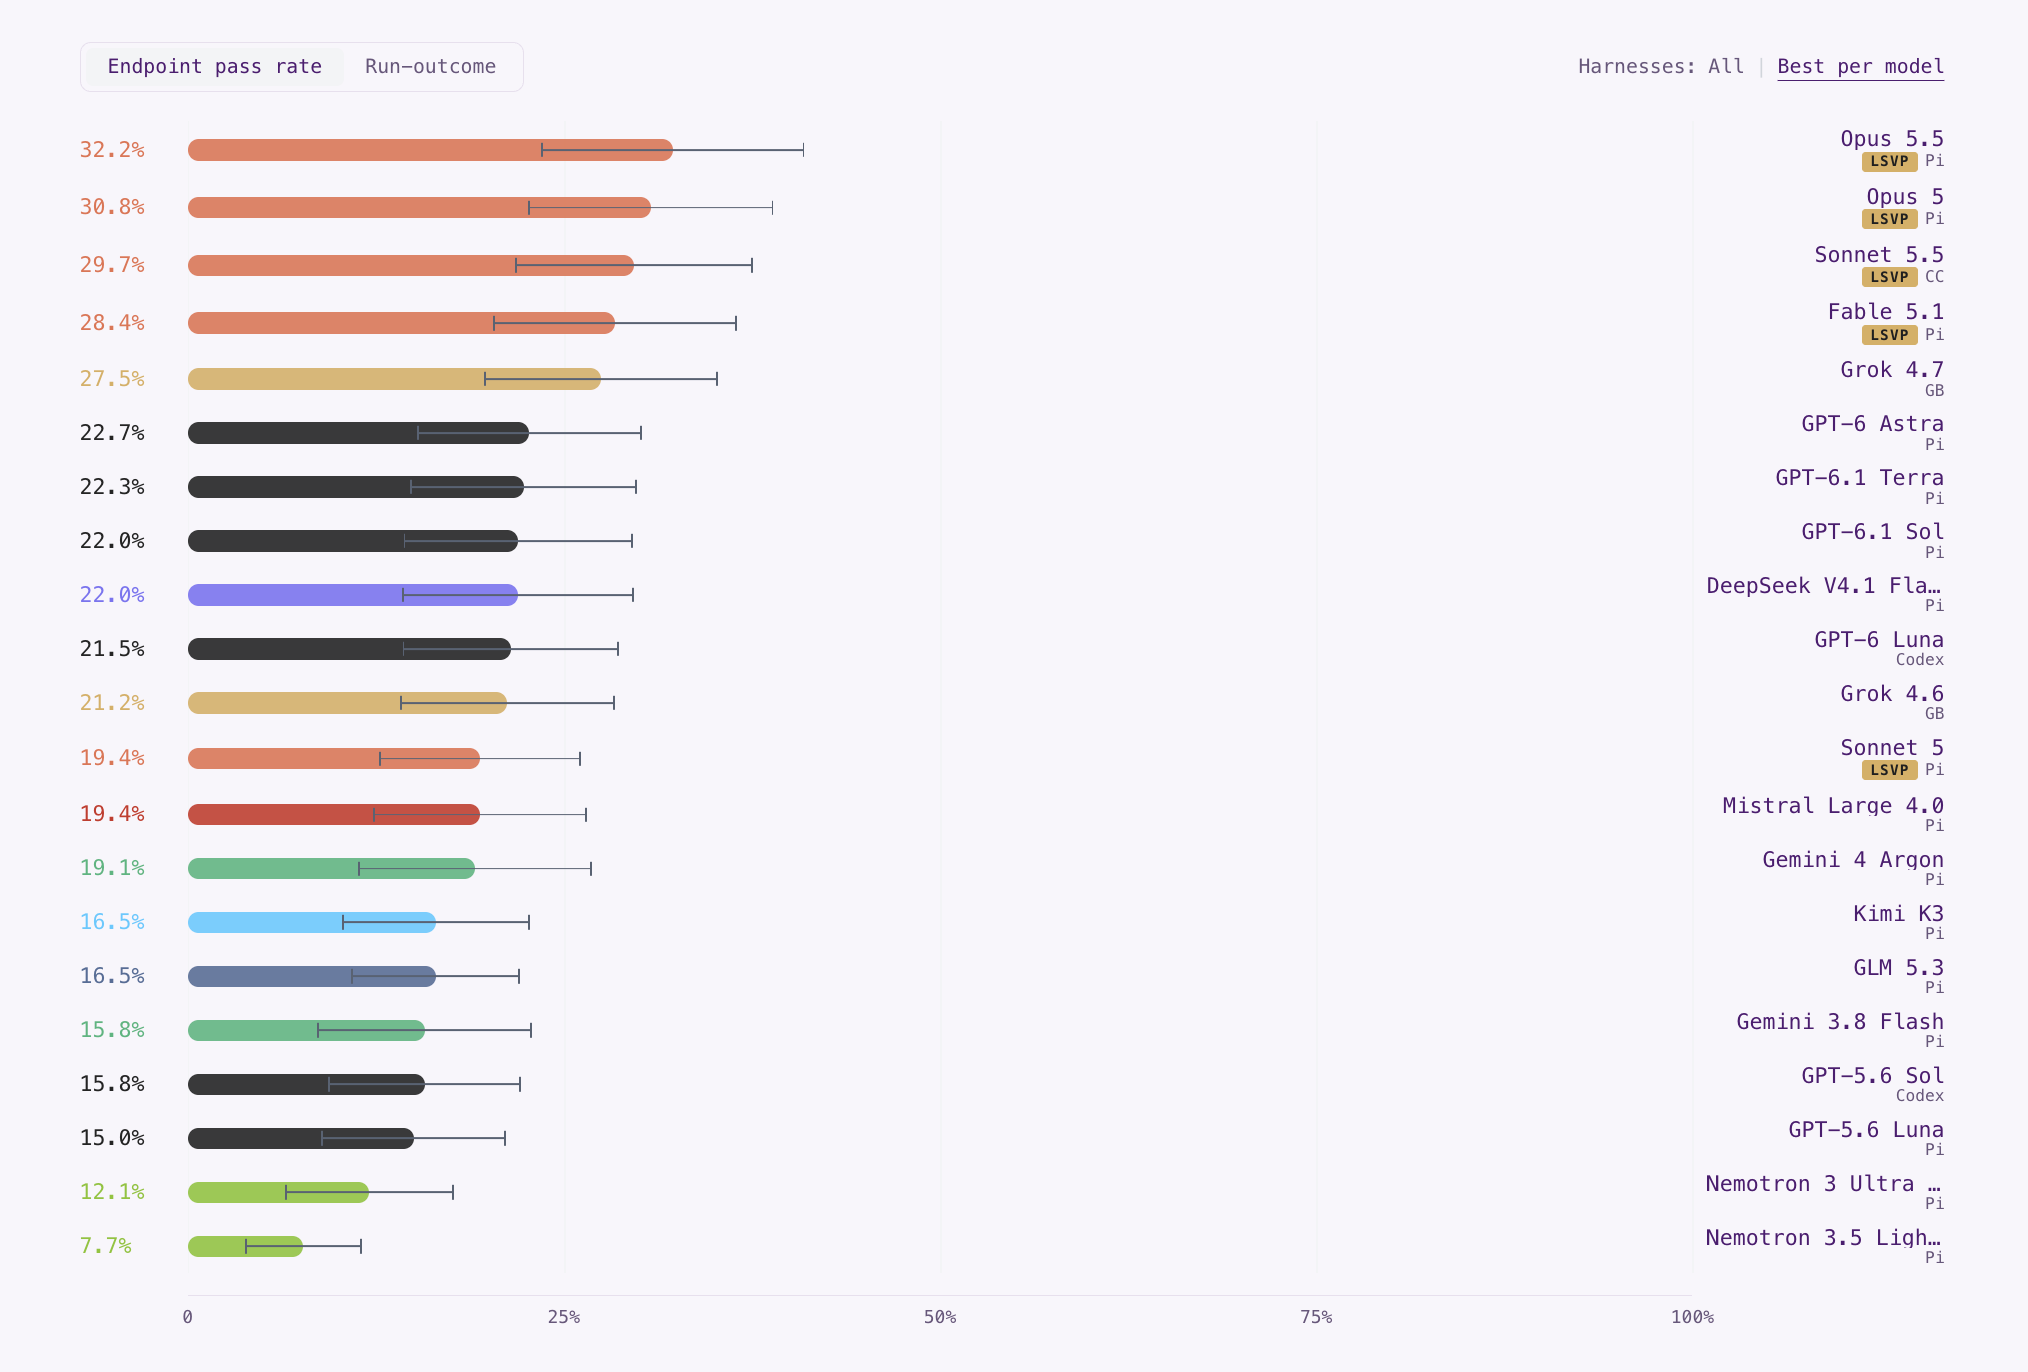
No agent passed more than 33% of attempts. Claude Opus 5.5 on the Pi harness led at 32.2%, and the mean across all 34 configurations was 21.0%.
The type of data mattered most. Mean pass rates ran from 14% on less common omics and 18% on clinical and biofluid data to about 25% on behavior and on EEG and sleep scoring, and individual models swung by about 28 points between their best and worst data type.
The hardest mistakes were conceptual, not computational. Agents most often fell for quality-control and artifact traps, and for inference errors such as equivocation, reading correlation as causation, and missing a confounder.
Benchmark Design
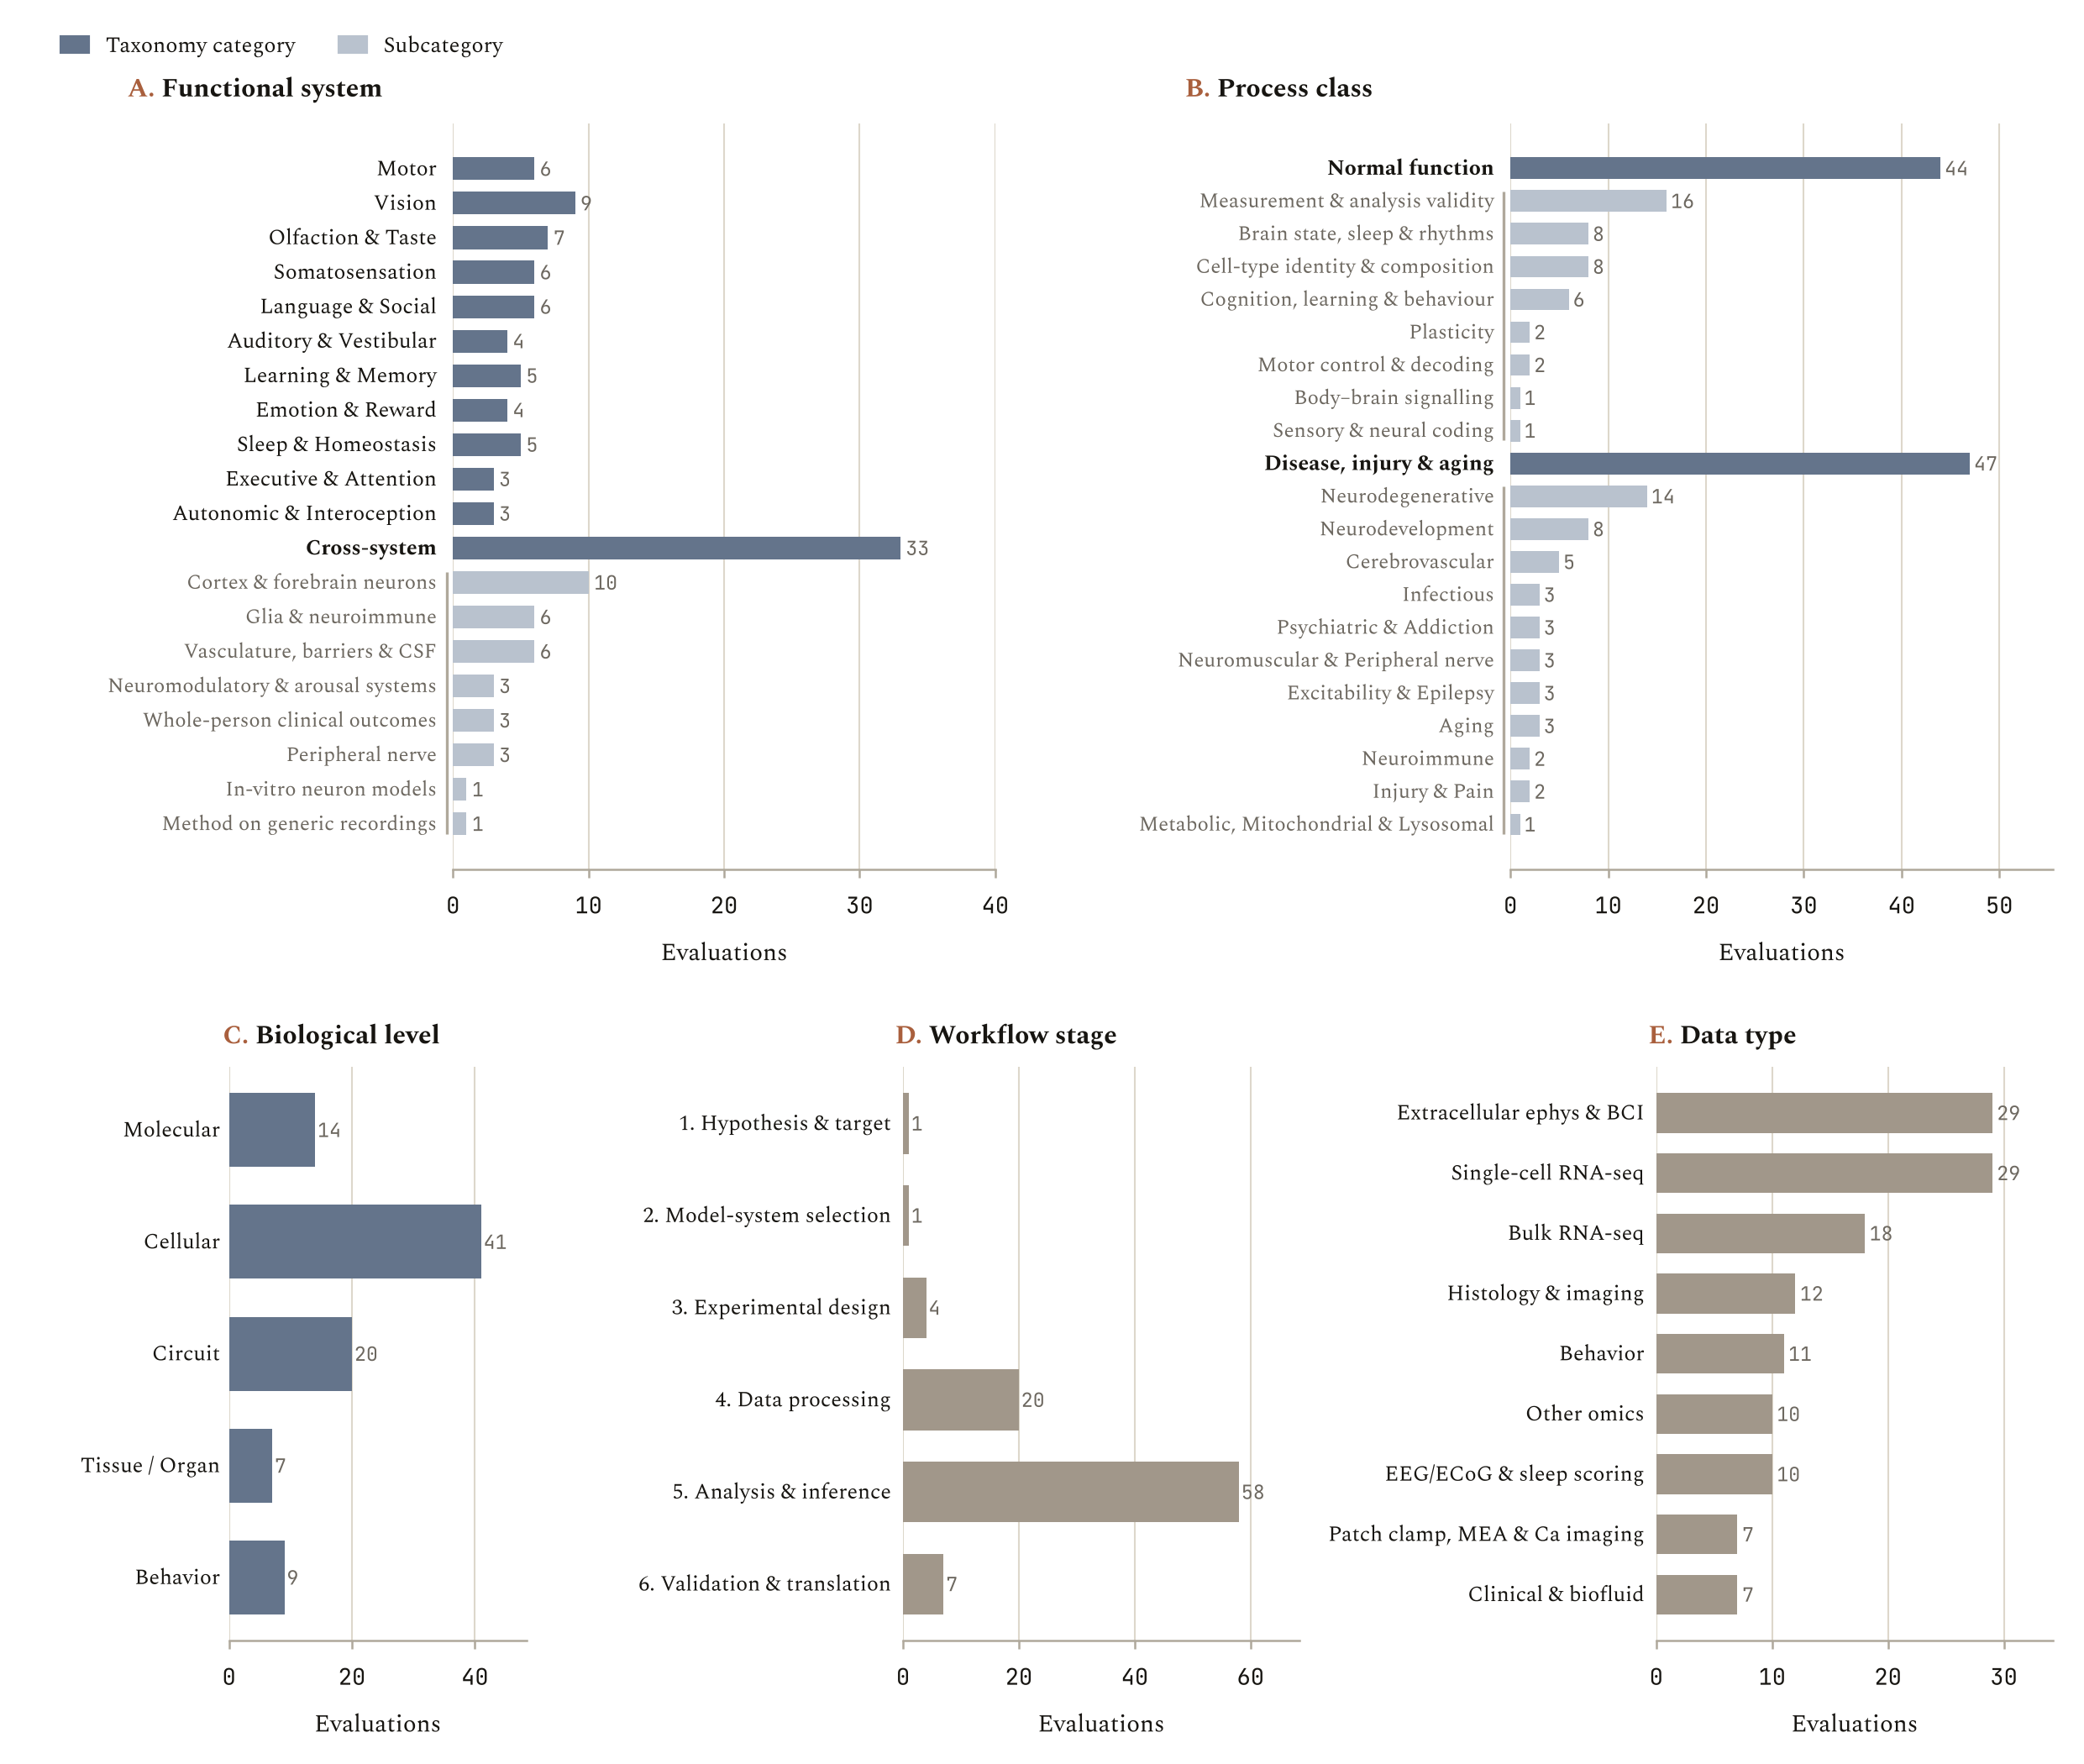
Each evaluation centers on one decision or judgement call where subsequent analysis can go wrong, which we call a trap. The data in NeuroscienceBench include next-generation sequencing, extracellular electrophysiology and BCI decoding, EEG and ECoG, sleep scoring, histology and imaging, behavior and pose tracking, patch clamp and multi-electrode arrays, and clinical cohorts. Numeric answers must fall within a tolerance or an admissible range, categorical answers must match exactly, and sets are scored by overlap. Before inclusion, every evaluation passed automated checks for shortcuts (tasks answerable without touching the data), guessability and near-duplication.
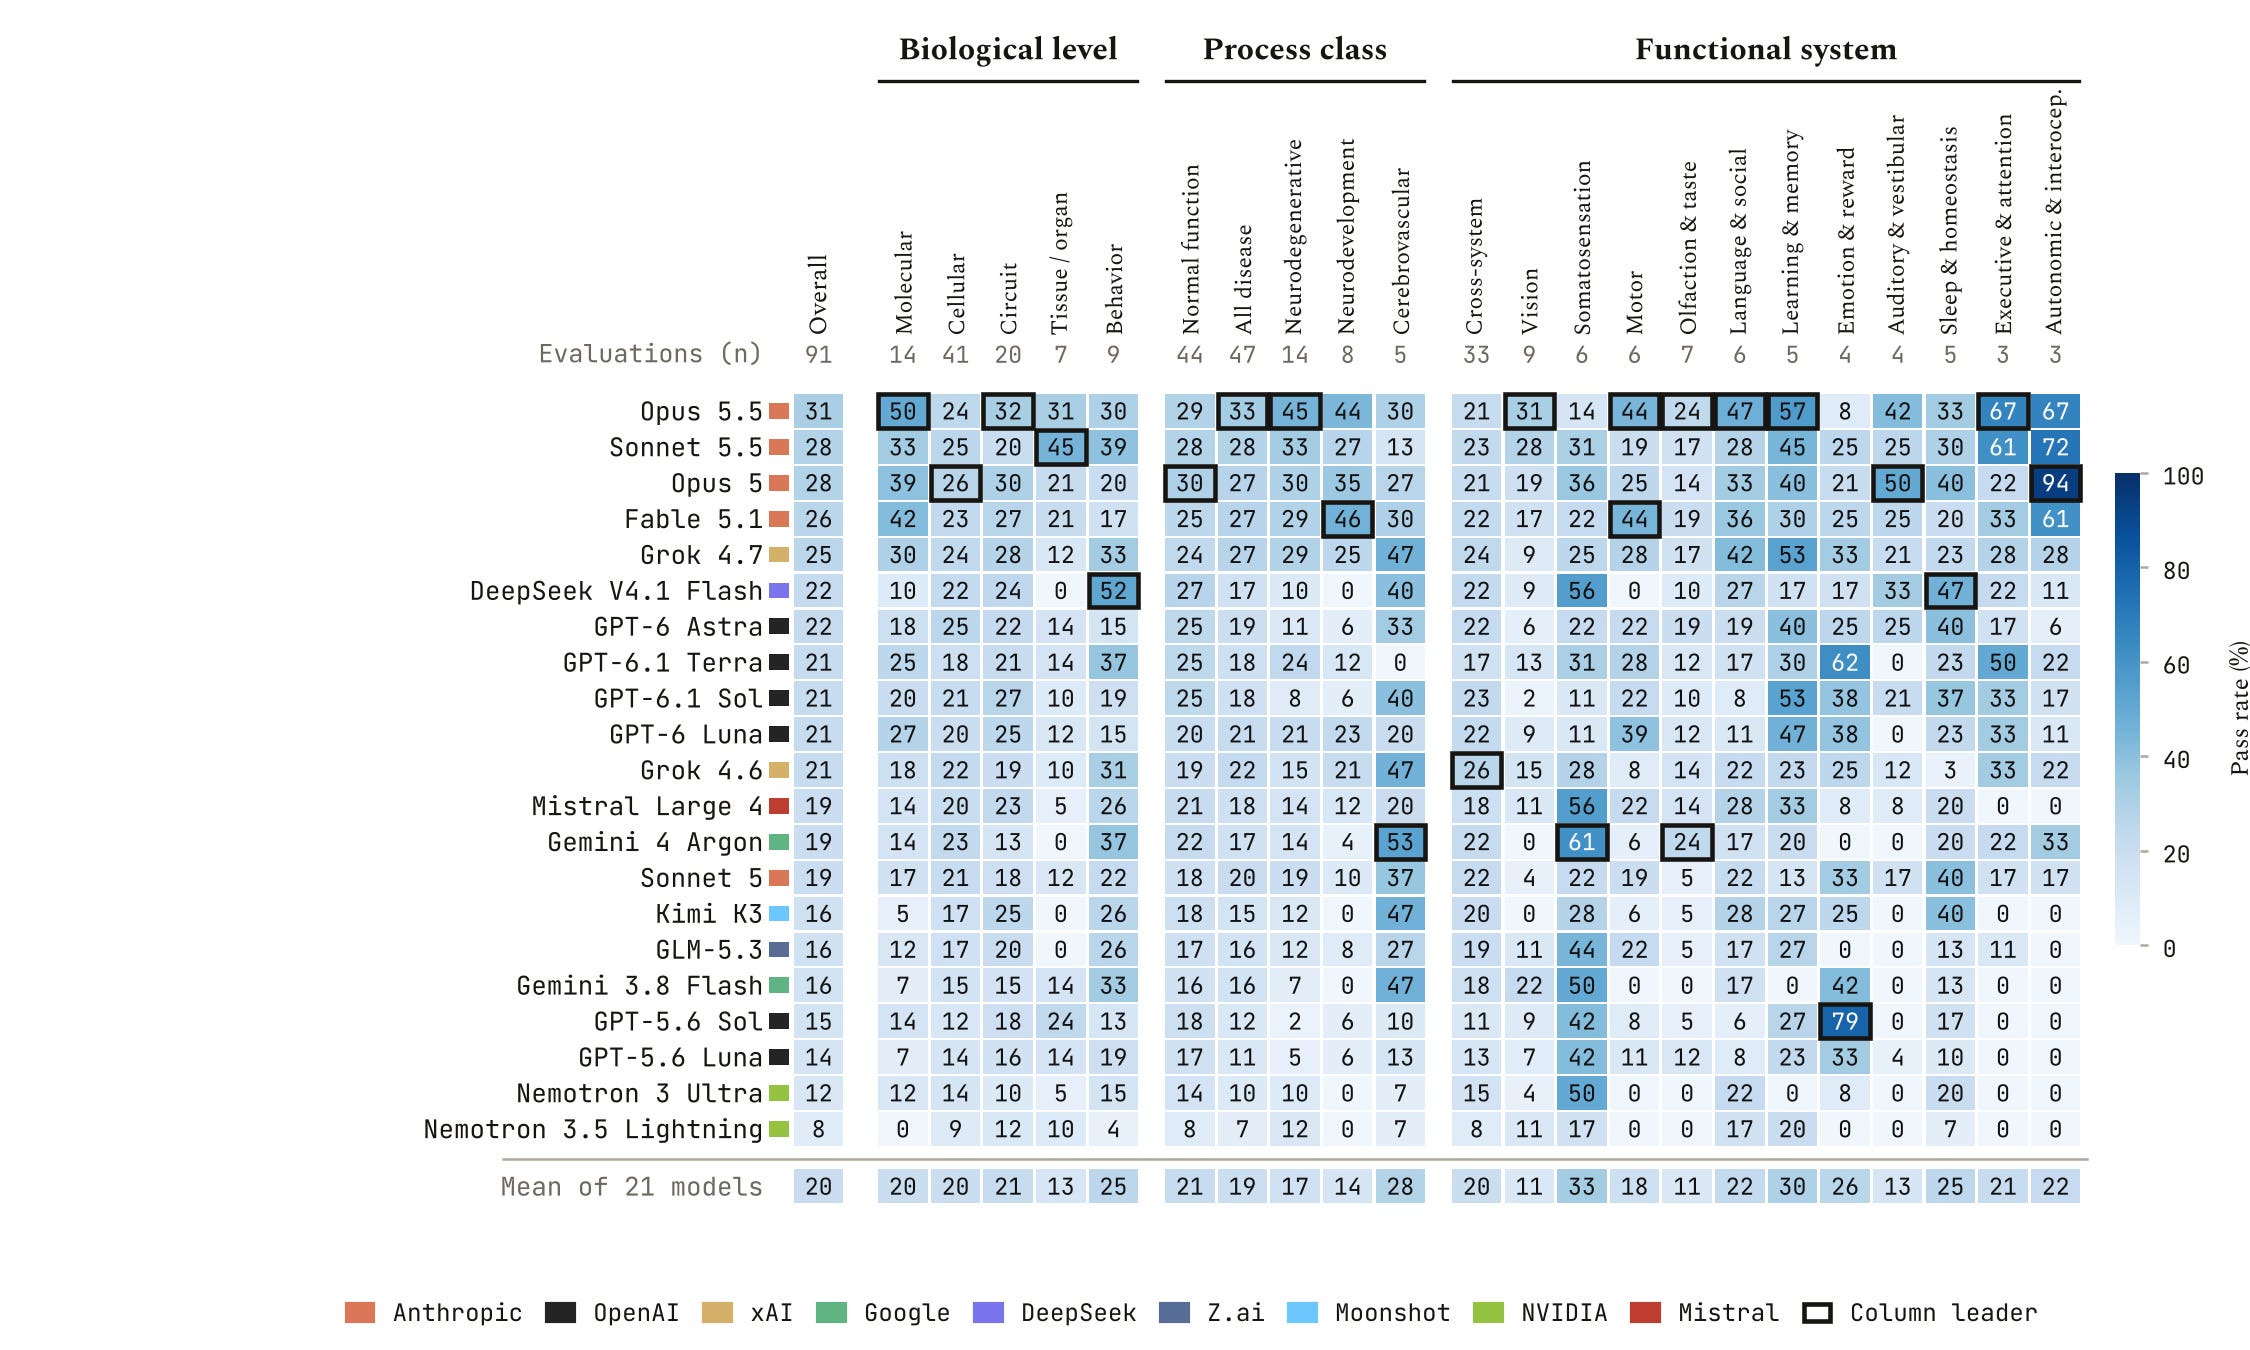
Every evaluation is tagged across three axes; the functional system studied (motor, vision, olfaction and taste, etc), the process class (normal function versus disease, injury, and aging), and the biological level at which the analysis occurs, ranging from molecular through behavior. Each evaluation carries an additional workflow stage and one or more data types. All runs were made without internet access.
Leaderboard and Efficiency
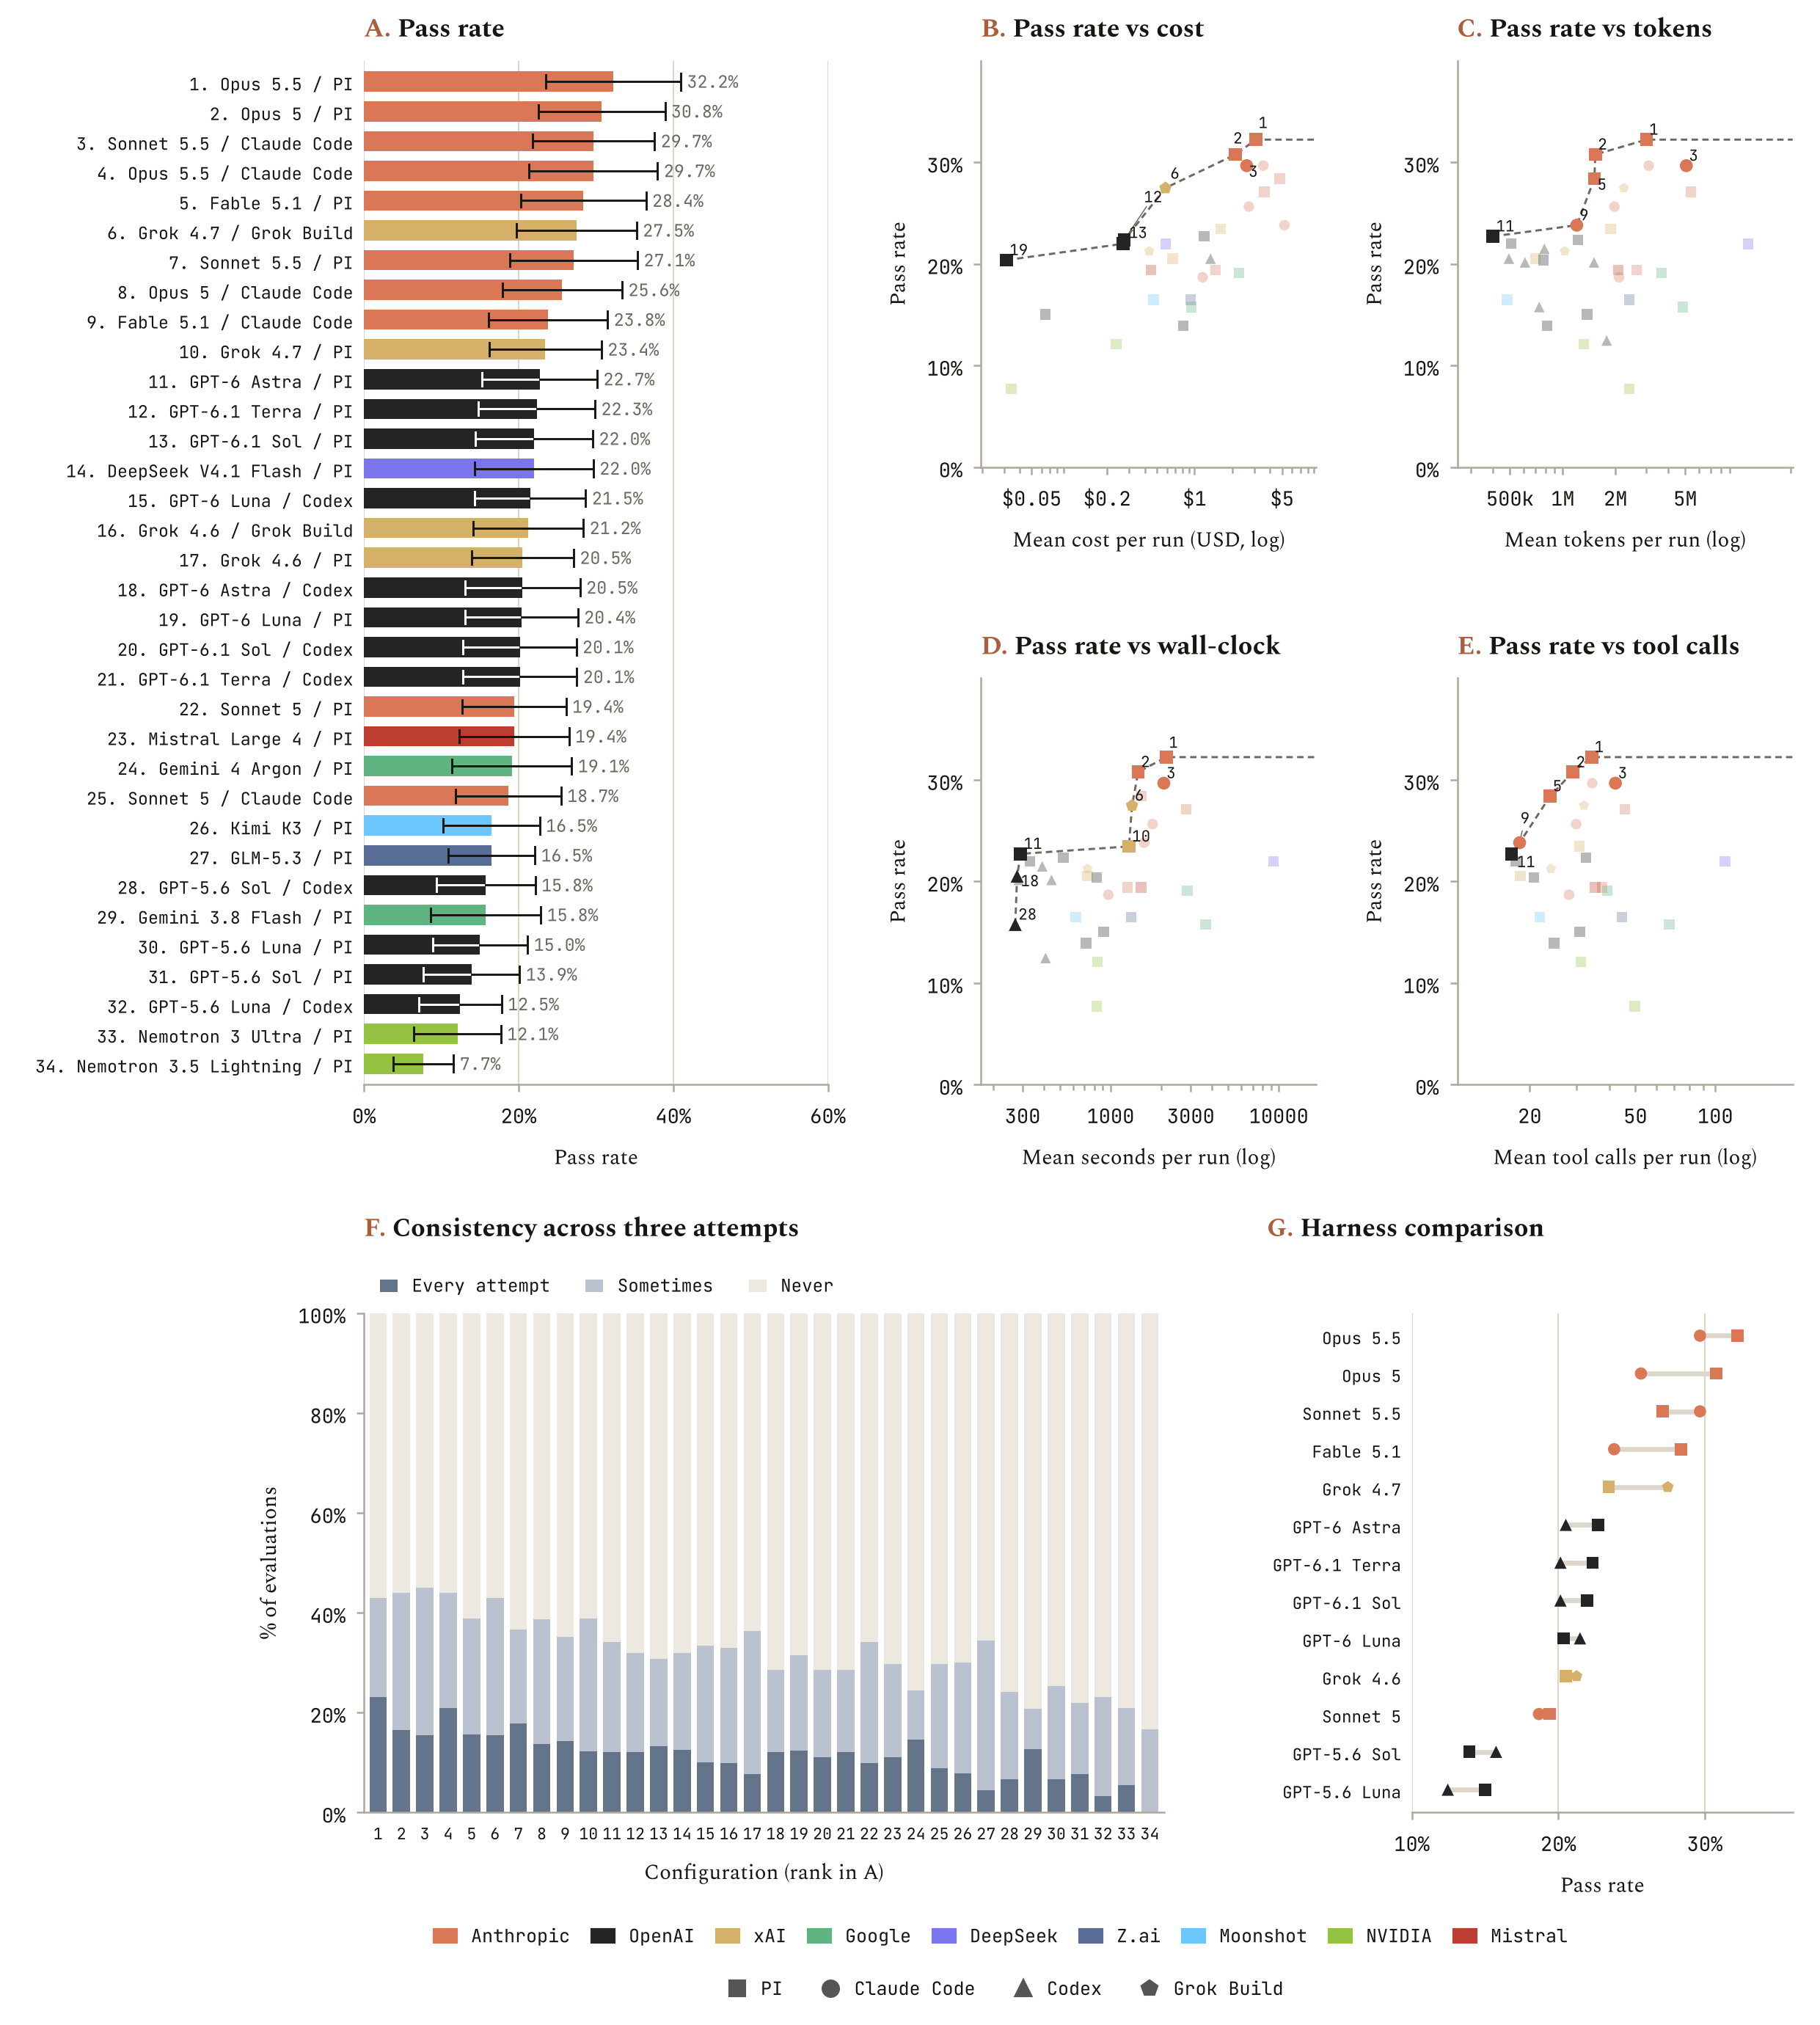
The benchmark consists of 34 configurations of 21 models under four harnesses (Pi, Claude Code, OpenAI Codex and Grok Build), with each configuration running three attempts per evaluation. After excluding 66 platform failures and 4 refusals, 9,212 graded attempts remained.
Of the tested models, those in the Claude family performed best; Opus 5.5 / Pi at 32.2% (95% CI 23.5 to 41.0), Opus 5 / Pi at 30.8%, Sonnet 5.5 / Claude Code at 29.7% and Opus 5.5 / Claude Code at 29.7%. Grok 4.7 / Grok Build was the strongest non-Anthropic configuration at 27.5%. The confidence intervals of the top ten configurations overlap and do not show any breakaway performances. Tasks were designed to be difficult, but not impossible; 78 of the 91 evaluations were solved by at least one configuration, and 61 were solved on every attempt by at least one.
Accuracy rose loosely with cost (Spearman ρ = 0.64). GPT-6 Luna / Pi passed 20.4% at about $0.03 per run, which is roughly 12 points behind the leader but at about one-hundredth of the cost. Meanwhile the most expensive configuration, Fable 5.1 / Claude Code averaged $5.22 per run, with a pass rate of 23.8%.
Agents show inconsistency across their three attempts. 68.1% of evaluations were never solved across all configuration and evaluation pairs, 11.4% were solved every time, and 20.5% only some of the time. Even Opus 5.5, the top performer, solved 42.9% of evaluations at least once but only 23.1% on all three attempts. No harness outperformed across the board. Opus 5 gained 5.1 points under Pi relative to Claude Code, Sonnet 5.5 did 2.6 points better under Claude Code, and Grok 4.7 did 4.0 points better under Grok Build than under Pi.
The Data Type Decides
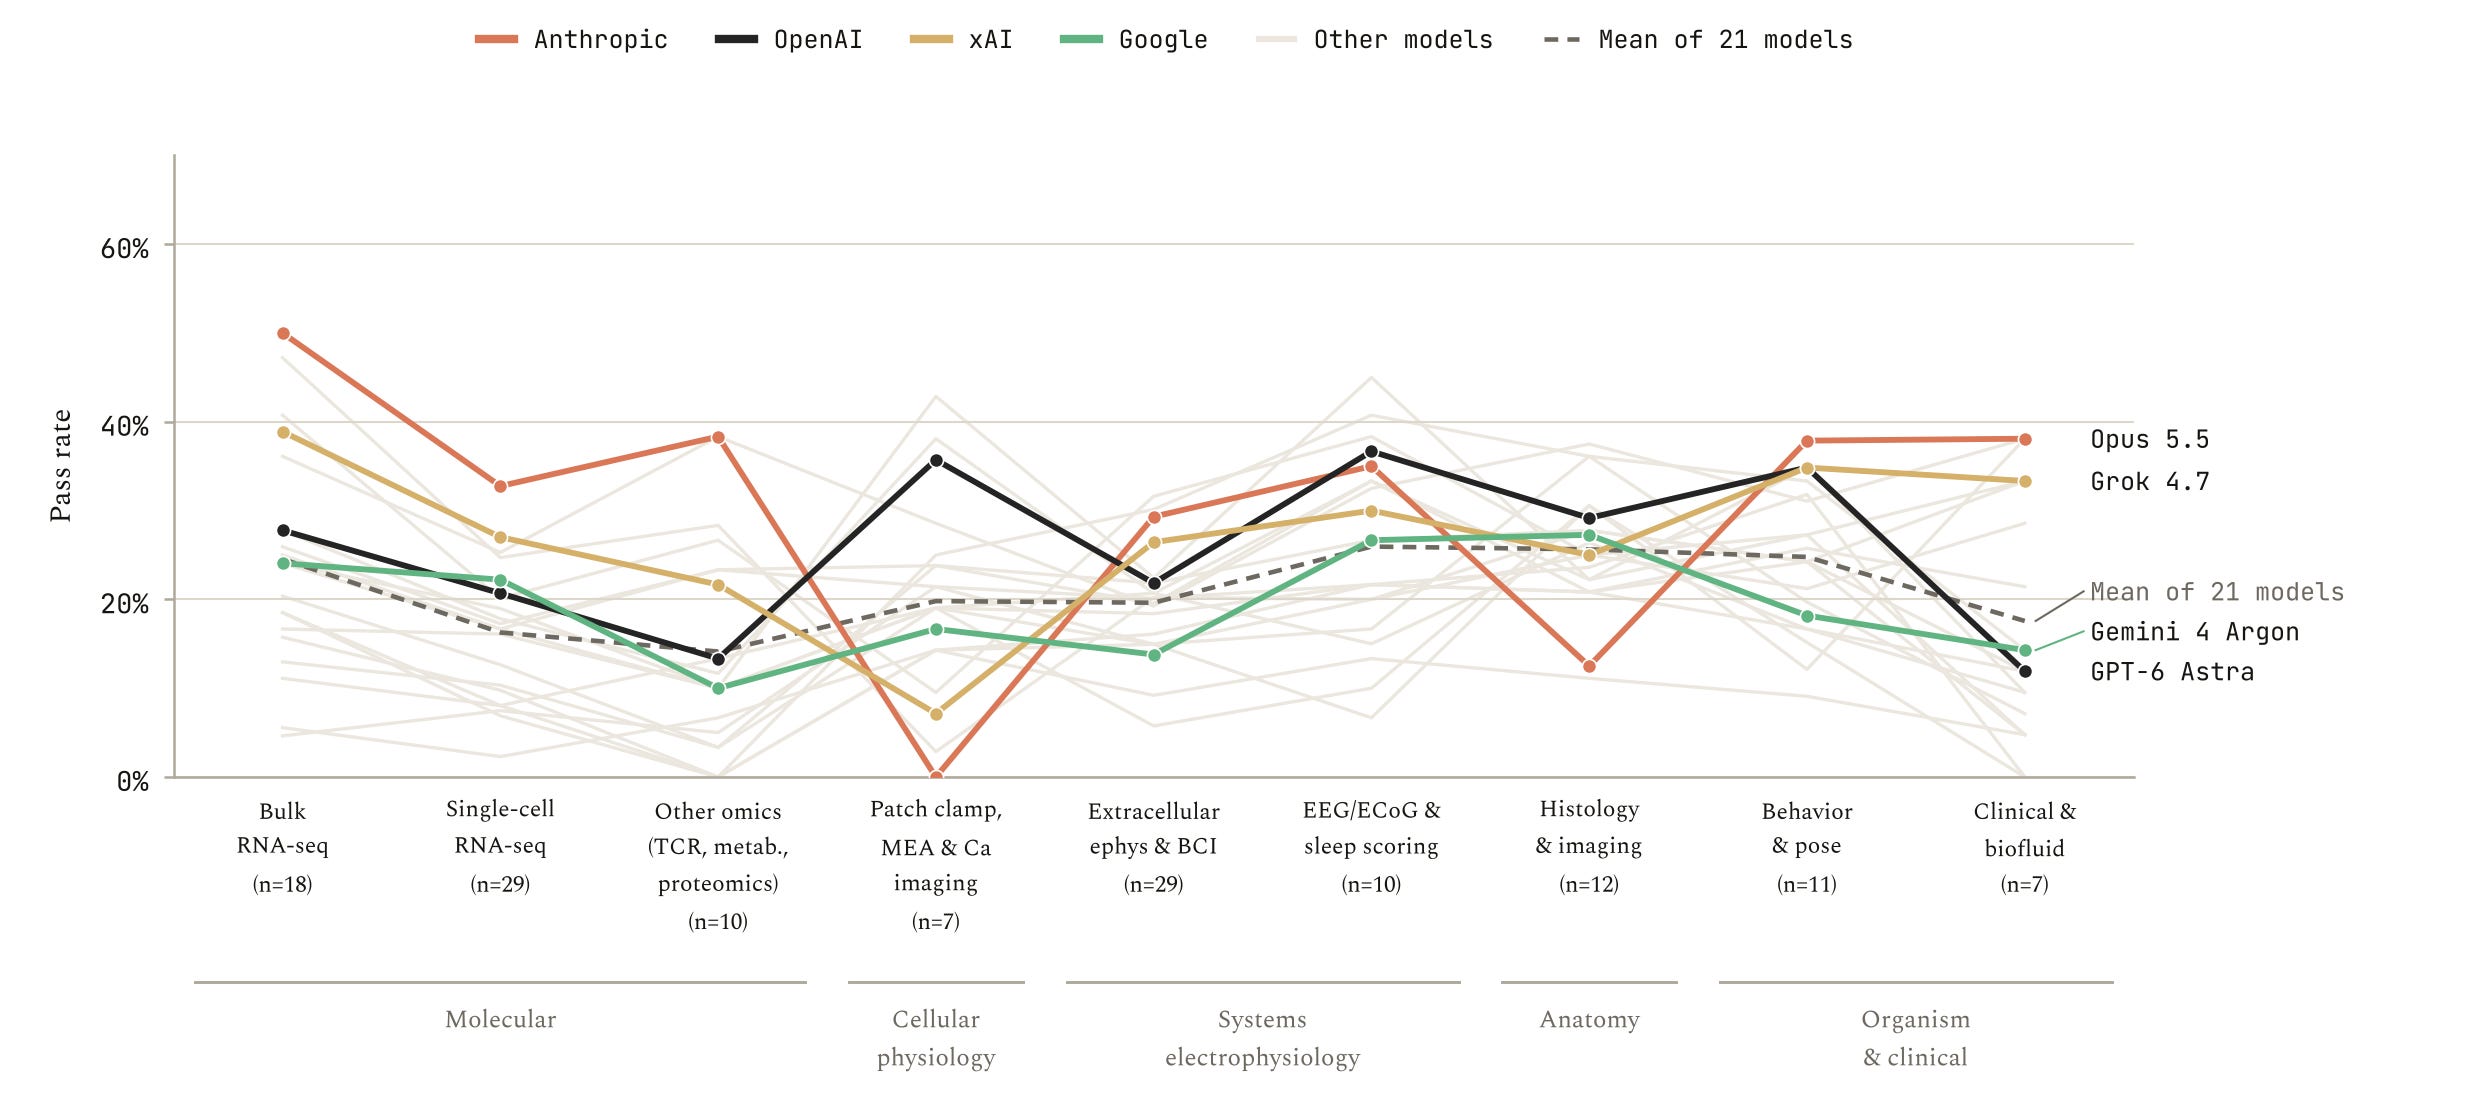
The data used in an evaluation ended up being a high predictor of difficulty. Less common omics readouts such as TCR-seq, metabolomics and proteomics (14.1%), single-cell RNA-seq (16.3%) and clinical and biofluid data (17.6%) had the lowest pass rates, while EEG, ECoG and sleep scoring (25.9%), histology and imaging (25.6%), behavior and pose tracking (24.8%) and bulk RNA-seq (24.6%) had the highest. The two most common data types, single-cell RNA-seq (16.3%) and extracellular electrophysiology or BCI decoding (19.6%), sat below the mean of 20.1%.
Frontier models also have different strengths. Opus 5.5 passed 50.0% of bulk RNA-seq evaluations but none of those using patch clamp, multi-electrode arrays or calcium imaging, whereas GPT-6 Astra passed 35.7% of the latter and only 11.9% of clinical and biofluid evaluations. On average, a model’s best and worst data types were 28 points apart.
Topic Mattered Less Than Expected
By functional system, pass rates ranged from vision (11.3%) and olfaction and taste (11.2%) to somatosensation (33.2%). While there is a large spread present, most systems contain only three to nine evaluations, and we found pass rates vary as much within a system as across the whole benchmark, and these differences are not significant (permutation test, p = 0.50). Agents did slightly better on normal function than on disease, injury and aging (21.2% vs 19.0%). The direction held for 14 of 21 models, but the gap was small and also not significant (p = 0.53). By biological level, tissue- and organ-level evaluations were hardest (13.0%) and behavioral evaluations easiest (25.1%).
Models Fell for Conceptual Traps
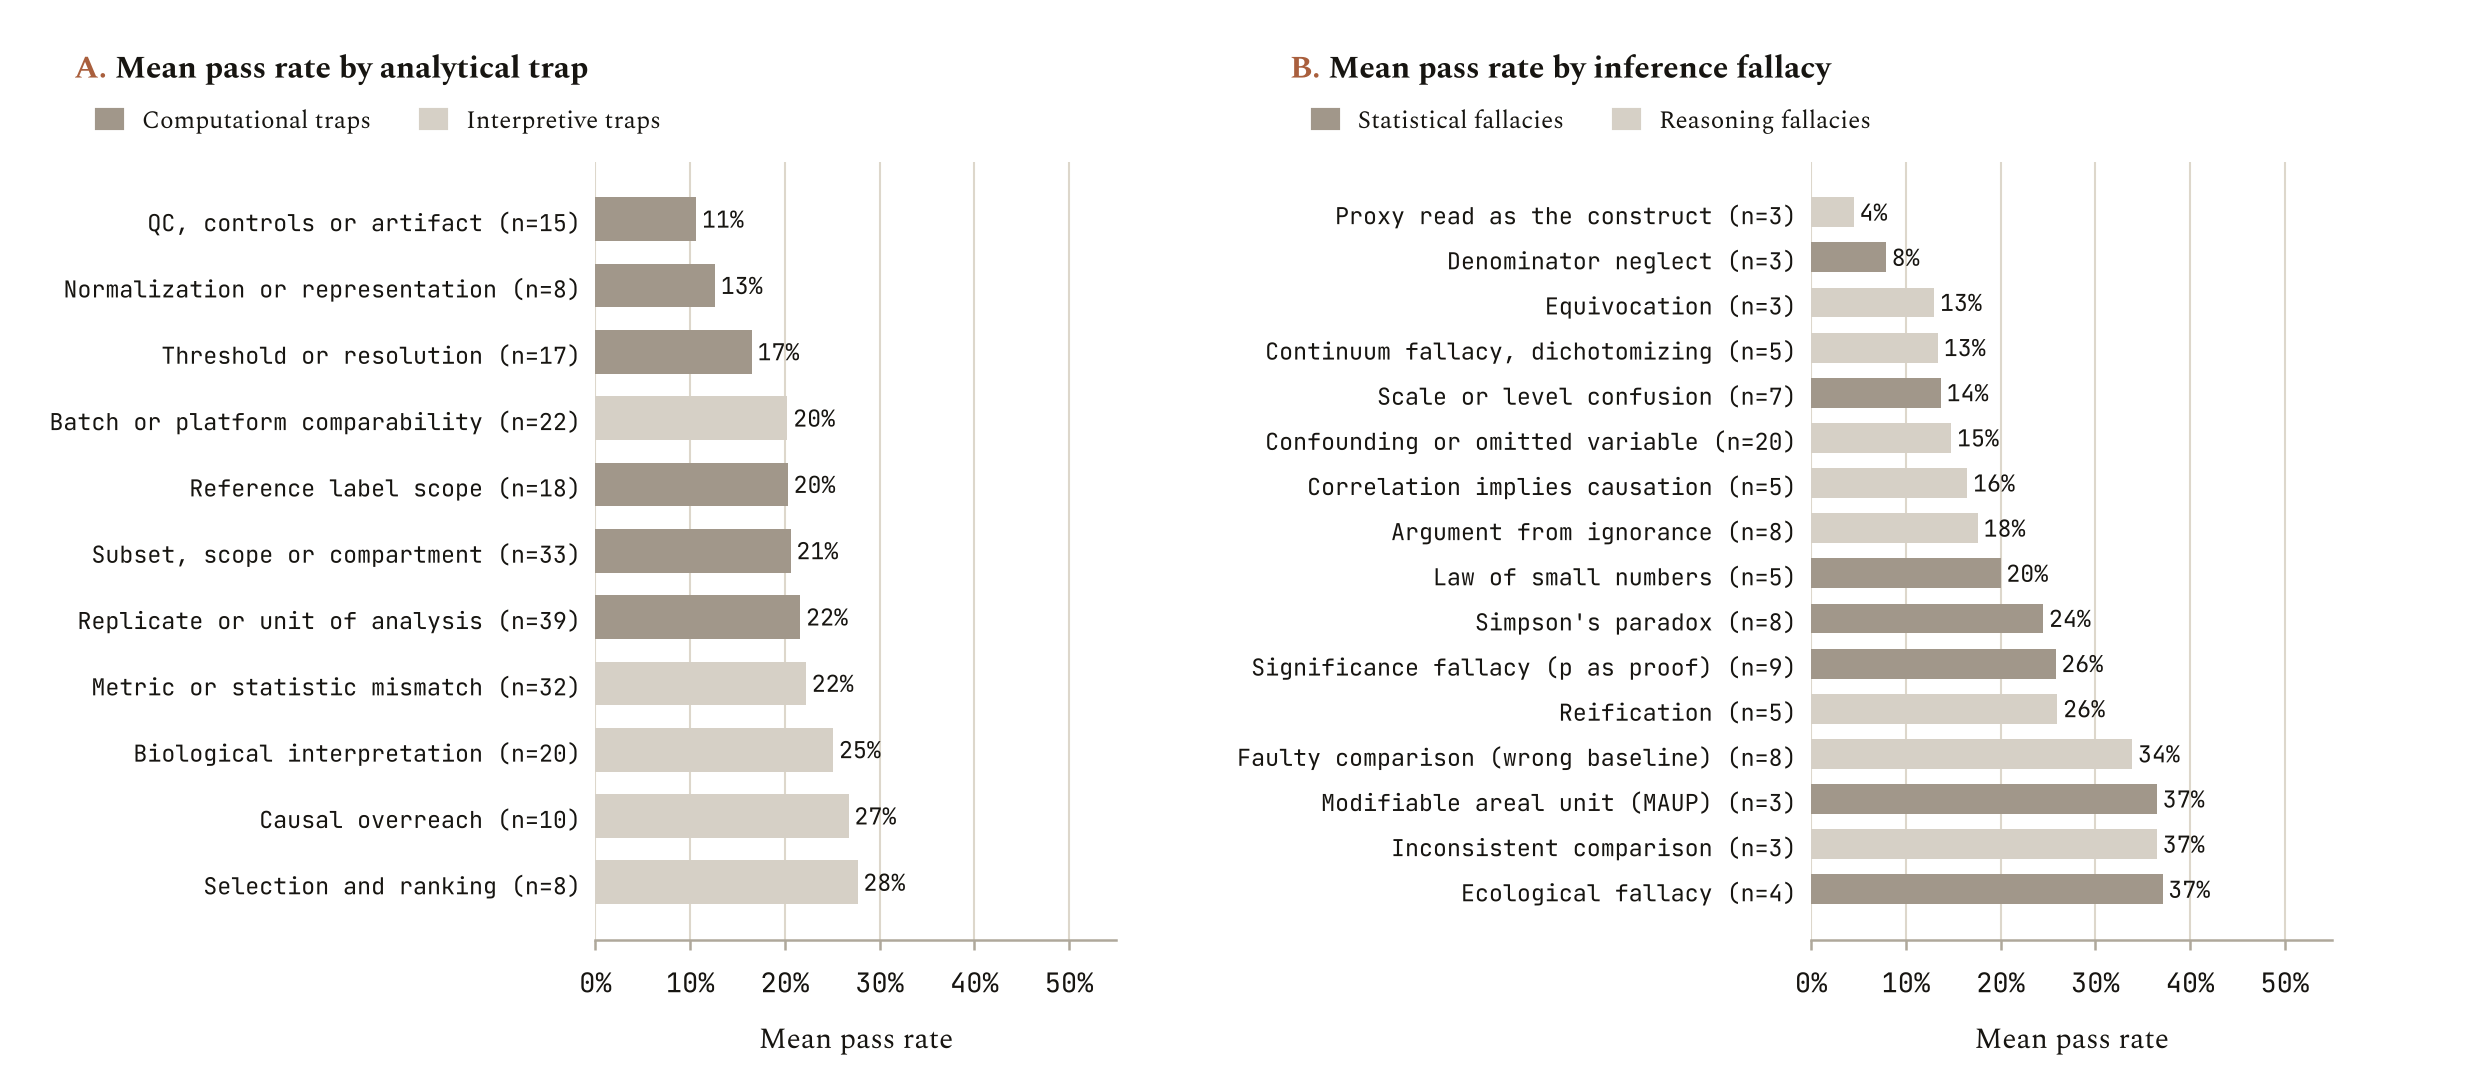
Each evaluation is built around at least one analytical trap (the processing or analysis choice where an agent can go wrong) and one or more inference fallacies (the faulty step from evidence to conclusion that a wrong choice produces). Among traps, quality control, controls and artifacts were hardest (10.6%), followed by normalization and representation (12.6%) and threshold or resolution choices (16.5%). The most common traps, analyzing the wrong subset (20.6%), choosing the wrong unit of analysis (21.6%) and computing a statistic that doesn’t match the claim (22.2%), fell near the mean.
The hardest fallacies were treating a proxy as the thing it stands for (4.5%), denominator neglect (7.9%), equivocation (13.0%), the continuum fallacy (13.4%), scale or level confusion (13.7%) and confounding or an omitted variable (14.8%). Confounding is also the most common fallacy in the benchmark, present in more than one evaluation in five. Statistical fallacies such as Simpson’s paradox and the significance fallacy were intermediate, and errors of comparison and aggregation were easiest. Grouped together, statistical and reasoning fallacies had similar pass rates (22.4% vs 19.4%), so the difficulty lies in specific forms of inference rather than in one class.
Conclusion
NeuroscienceBench demonstrates that frontier agents can run neuroscience analyses across diverse data types, but they don’t reliably make the right judgement calls at critical junctures. In short, they can help with analyses, but they still require a neuroscientist-in-the-loop for making decisions.
NeuroscienceBench has limitations. Its evaluations are retrospective and built from published data, so anti-shortcut checks reduce but can’t rule out that a model has seen the source study - a key piece of evaluation creation was to avoid recapitulating the same decisions found in a publication to avoid this. Many categories contain fewer than ten evaluations, so category-level differences should be read as hypotheses. In development, evaluations were initially run on Claude Opus 5.5 and GPT-6 Astra to calibrate difficulty, and they ended up far apart in our rankings: Opus 5.5 ranked first, while GPT-6 Astra ranked eleventh under Pi and eighteenth under Codex.
Our hope is that NeuroscienceBench becomes a useful resource for researchers deciding where to trust an agent, and for model developers deciding where to improve. You can find more here:
At LatchBio, we build benchmarks to measure how well AI agents analyze real biological data. If that sounds interesting, we’re hiring.