
New Frontier Models Are Faster, Not More Reliable, at Spatial Biology
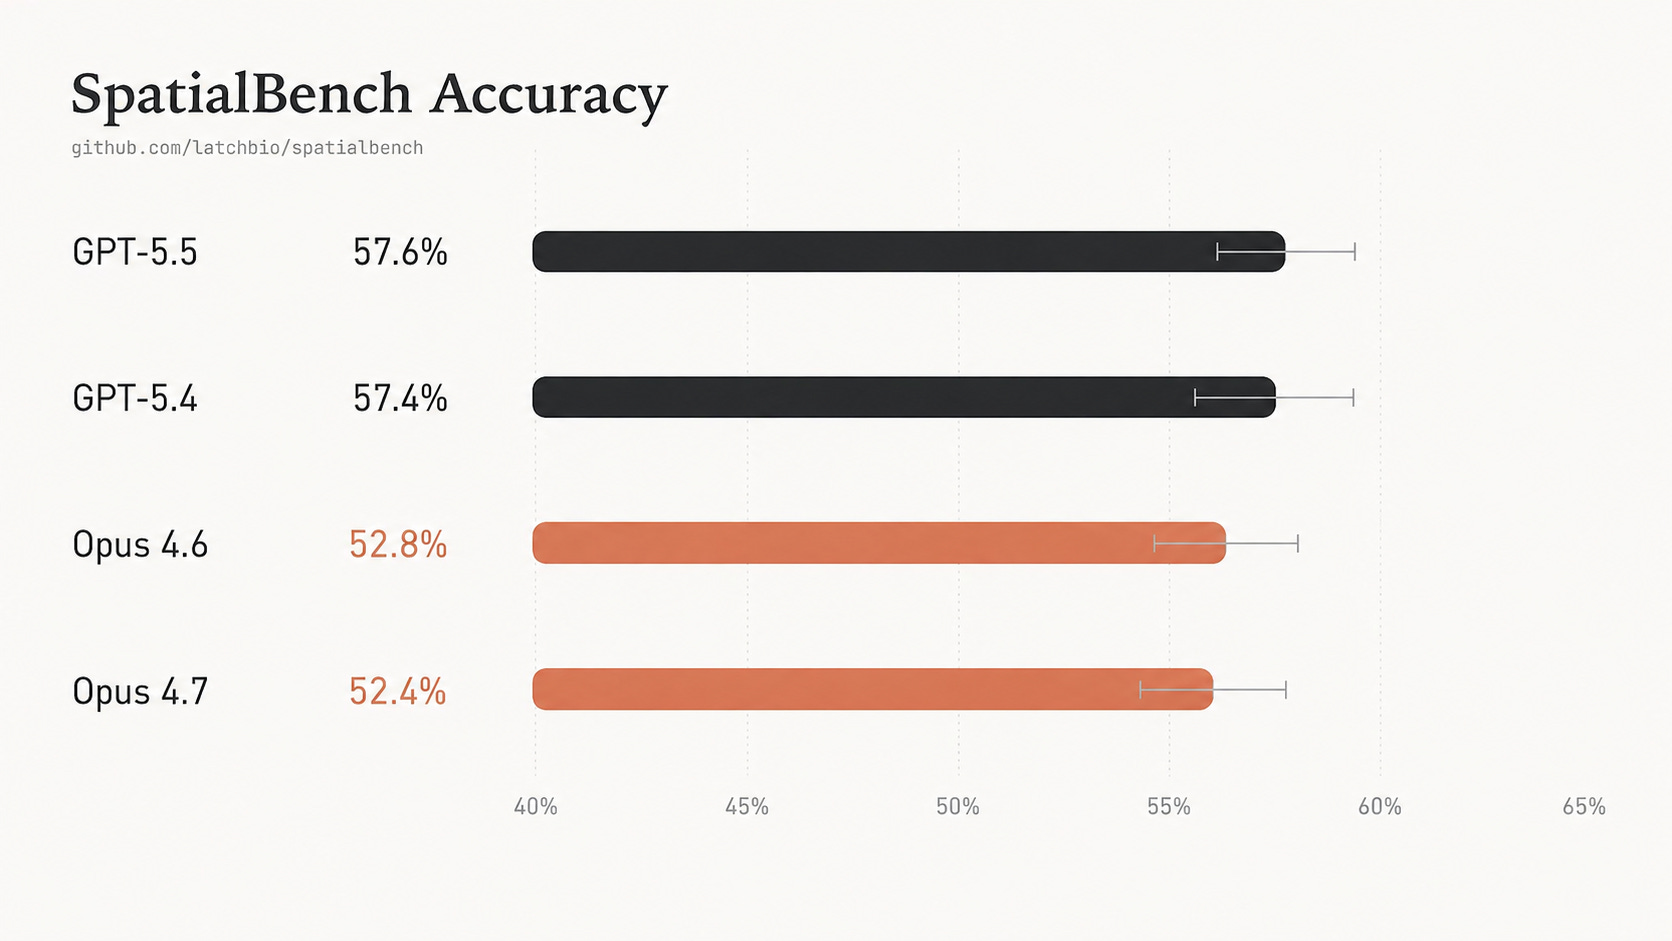
Overall accuracy for GPT-5.5 and Opus 4.7 remains flat on SpatialBench. Scientist-reviewed trajectories reveal persistent gaps in assay-aware biological judgment.


New frontier models are faster on SpatialBench, but not more accurate.
GPT-5.5 nearly halves runtime relative to GPT-5.4, yet accuracy remains flat: 57.6% versus 57.4%. Opus 4.7 is similarly tied with Opus 4.6: 52.4% versus 52.8%.
Scientist-reviewed trajectories reveal gaps in assay-aware biological judgment: statistical design, spatial units, batch structure, and scientific interpretation.
Complete benchmark data and select trajectories are available on benchmarks.bio.
What SpatialBench measures
Spatial biology is a powerful measurement tool and an important category for agentic capability. Analysis workflows require a combination of code and biological reasoning: agents must handle large data, understand platform-specific details, contextualize with scientific goals and return a quantitative result that matches what a diligent scientist would compute.
SpatialBench measures this work: 159 spatial biology analysis tasks across platforms like Xenium, Visium FFPE, MERFISH, TakaraBio Seeker, and AtlasXomics DBiT-seq. Each task starts from a real analysis state and asks an agent to recover a specific biological result. The grader checks structured outputs against expert-derived references (a subset of examples available here).
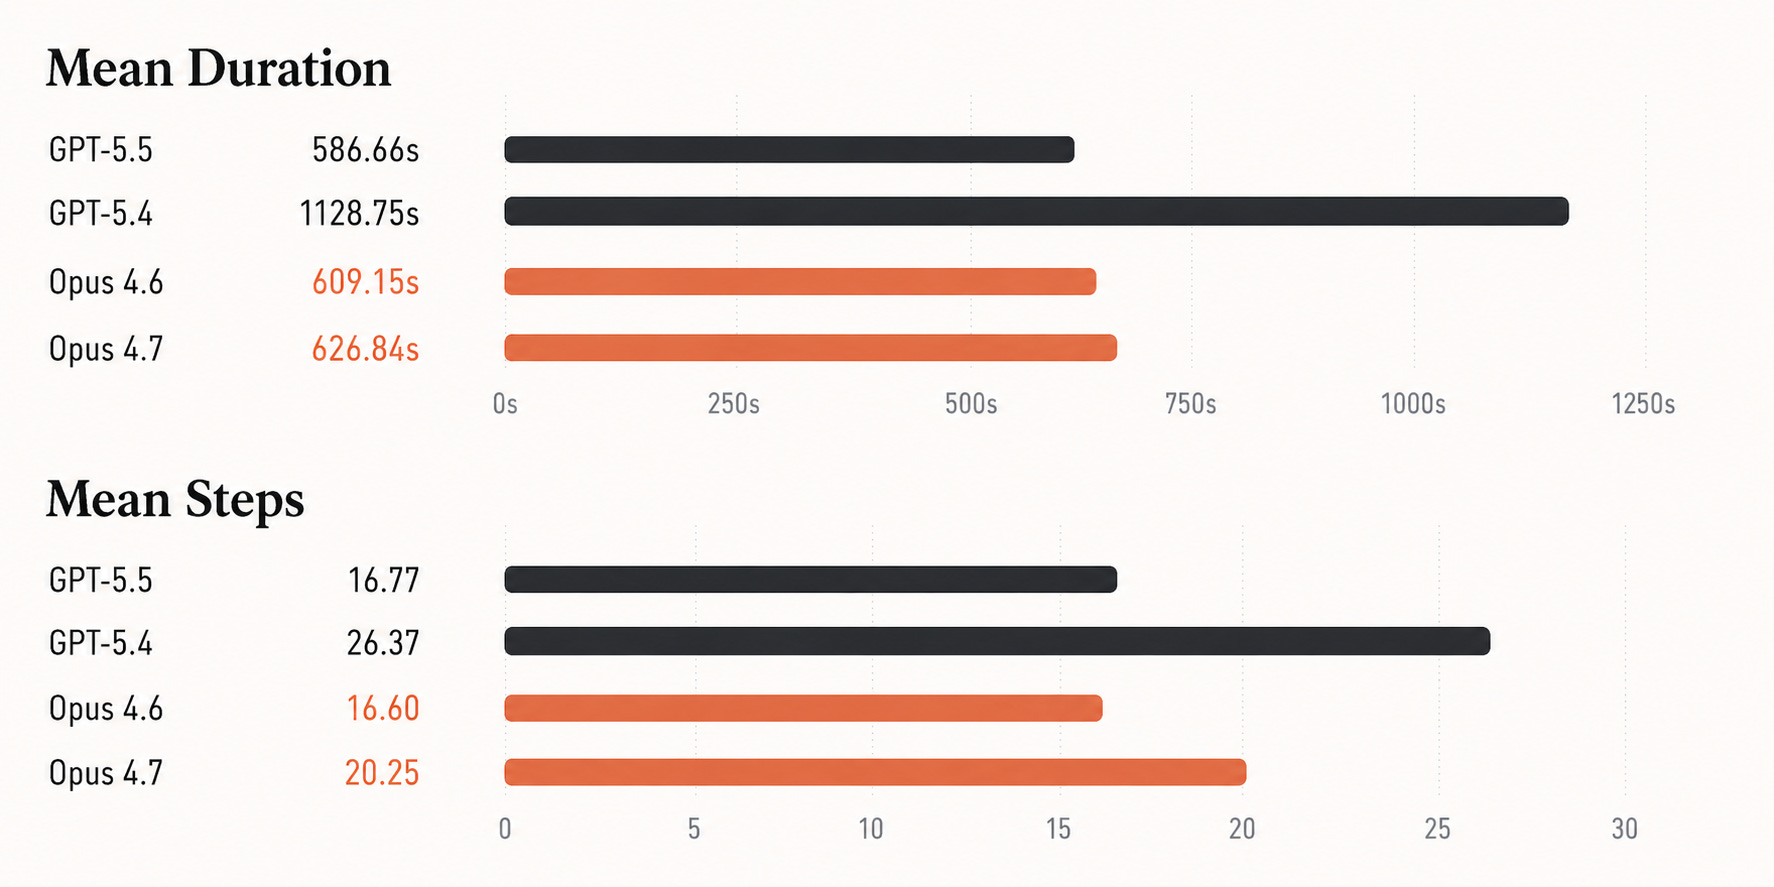
While frontier models show an improvement in speed and step count, they do not improve in overall accuracy on this benchmark.
GPT-5.5 is substantially faster than GPT-5.4, cutting mean duration roughly in half and using far fewer steps. But its accuracy is effectively unchanged: 57.65% versus 57.44%. Opus 4.7 is also effectively tied with Opus 4.6: 52.41% versus 52.83%.
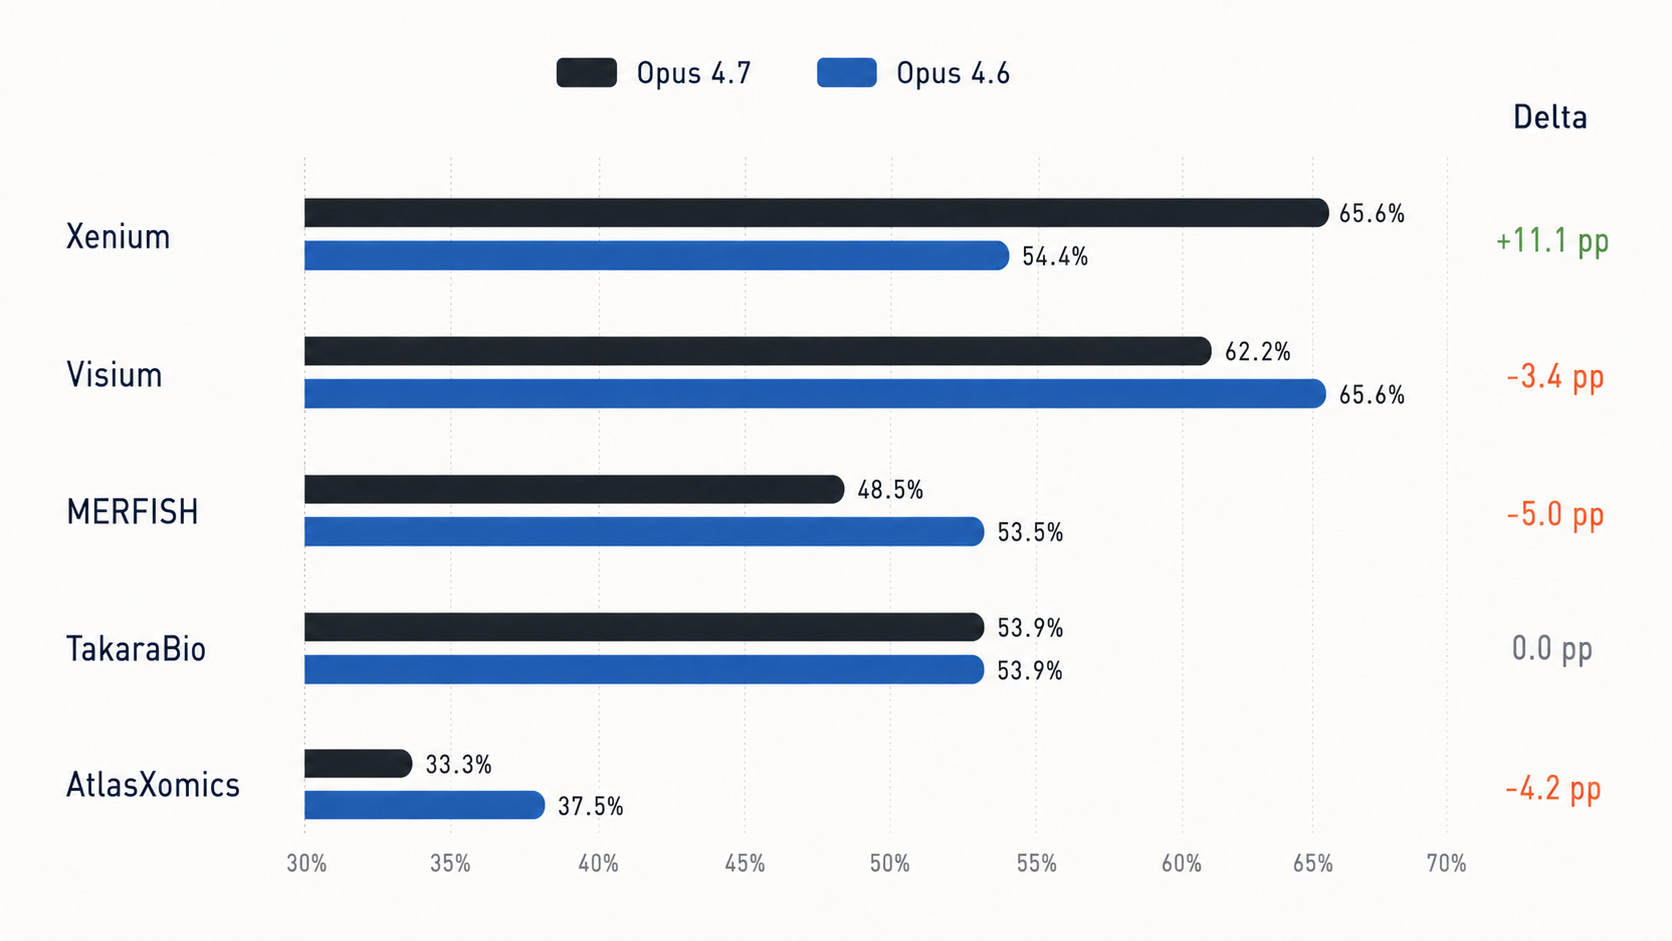
Accuracy by platform
Platform-level grouping shows GPT-5.5 improves on Visium, Xenium, and MERFISH, but trails GPT-5.4 on TakaraBio and AtlasXomics.
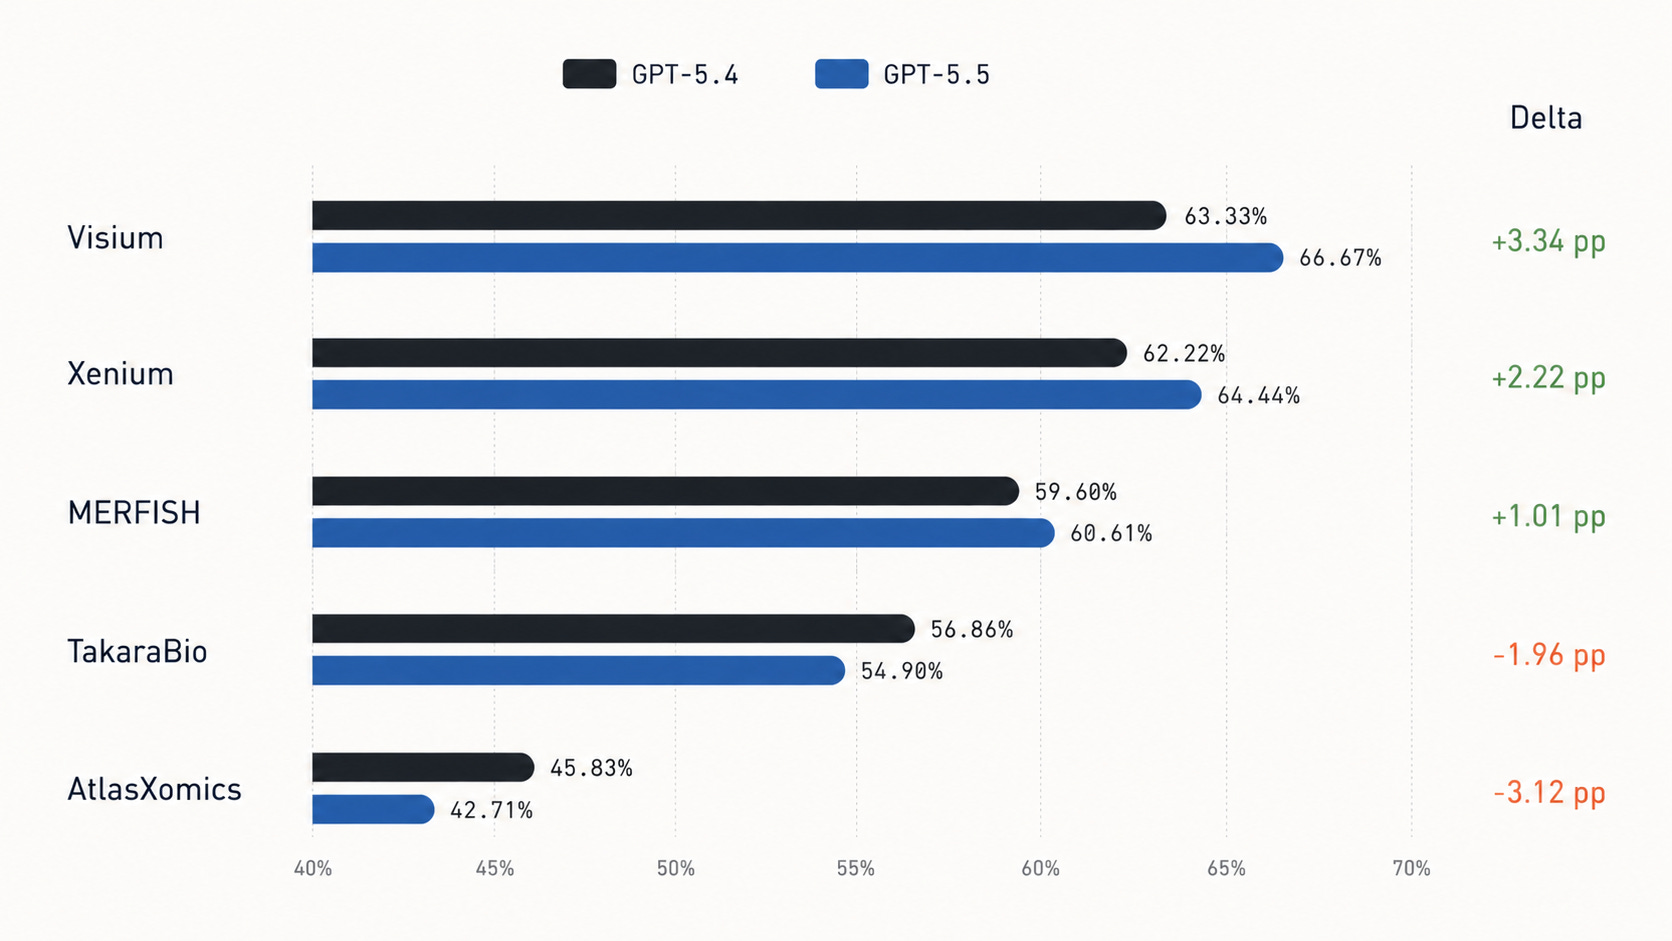
Similarly, Opus 4.7 leads Opus 4.6 on Xenium by 11.1 percentage points, ties on TakaraBio, and trails on Visium, MERFISH, and AtlasXomics:
A look at manually annotated trajectories
Trajectory review identifies recurring failure categories across model families:
Treating cells, beads, spots, or barcodes as independent observations when the biological replicate is the donor, animal, tissue section, or timepoint
Applying scRNA-seq normalization defaults to spatial platforms where they are inappropriate
Clustering multi-sample data without integration, then interpreting donor or timepoint structure incorrectly
Confusing spatial marker units for cells or anatomical structures
Failing to recover correct de novo niches, tissue states, and spatial compartments
We’ll dive into some examples to get a sense of failure modes in the context of realistic tasks. Each task trajectory was reviewed by a scientist with years of experience on the specific spatial platform being evaluated.
Barcode-level statistics create false positives
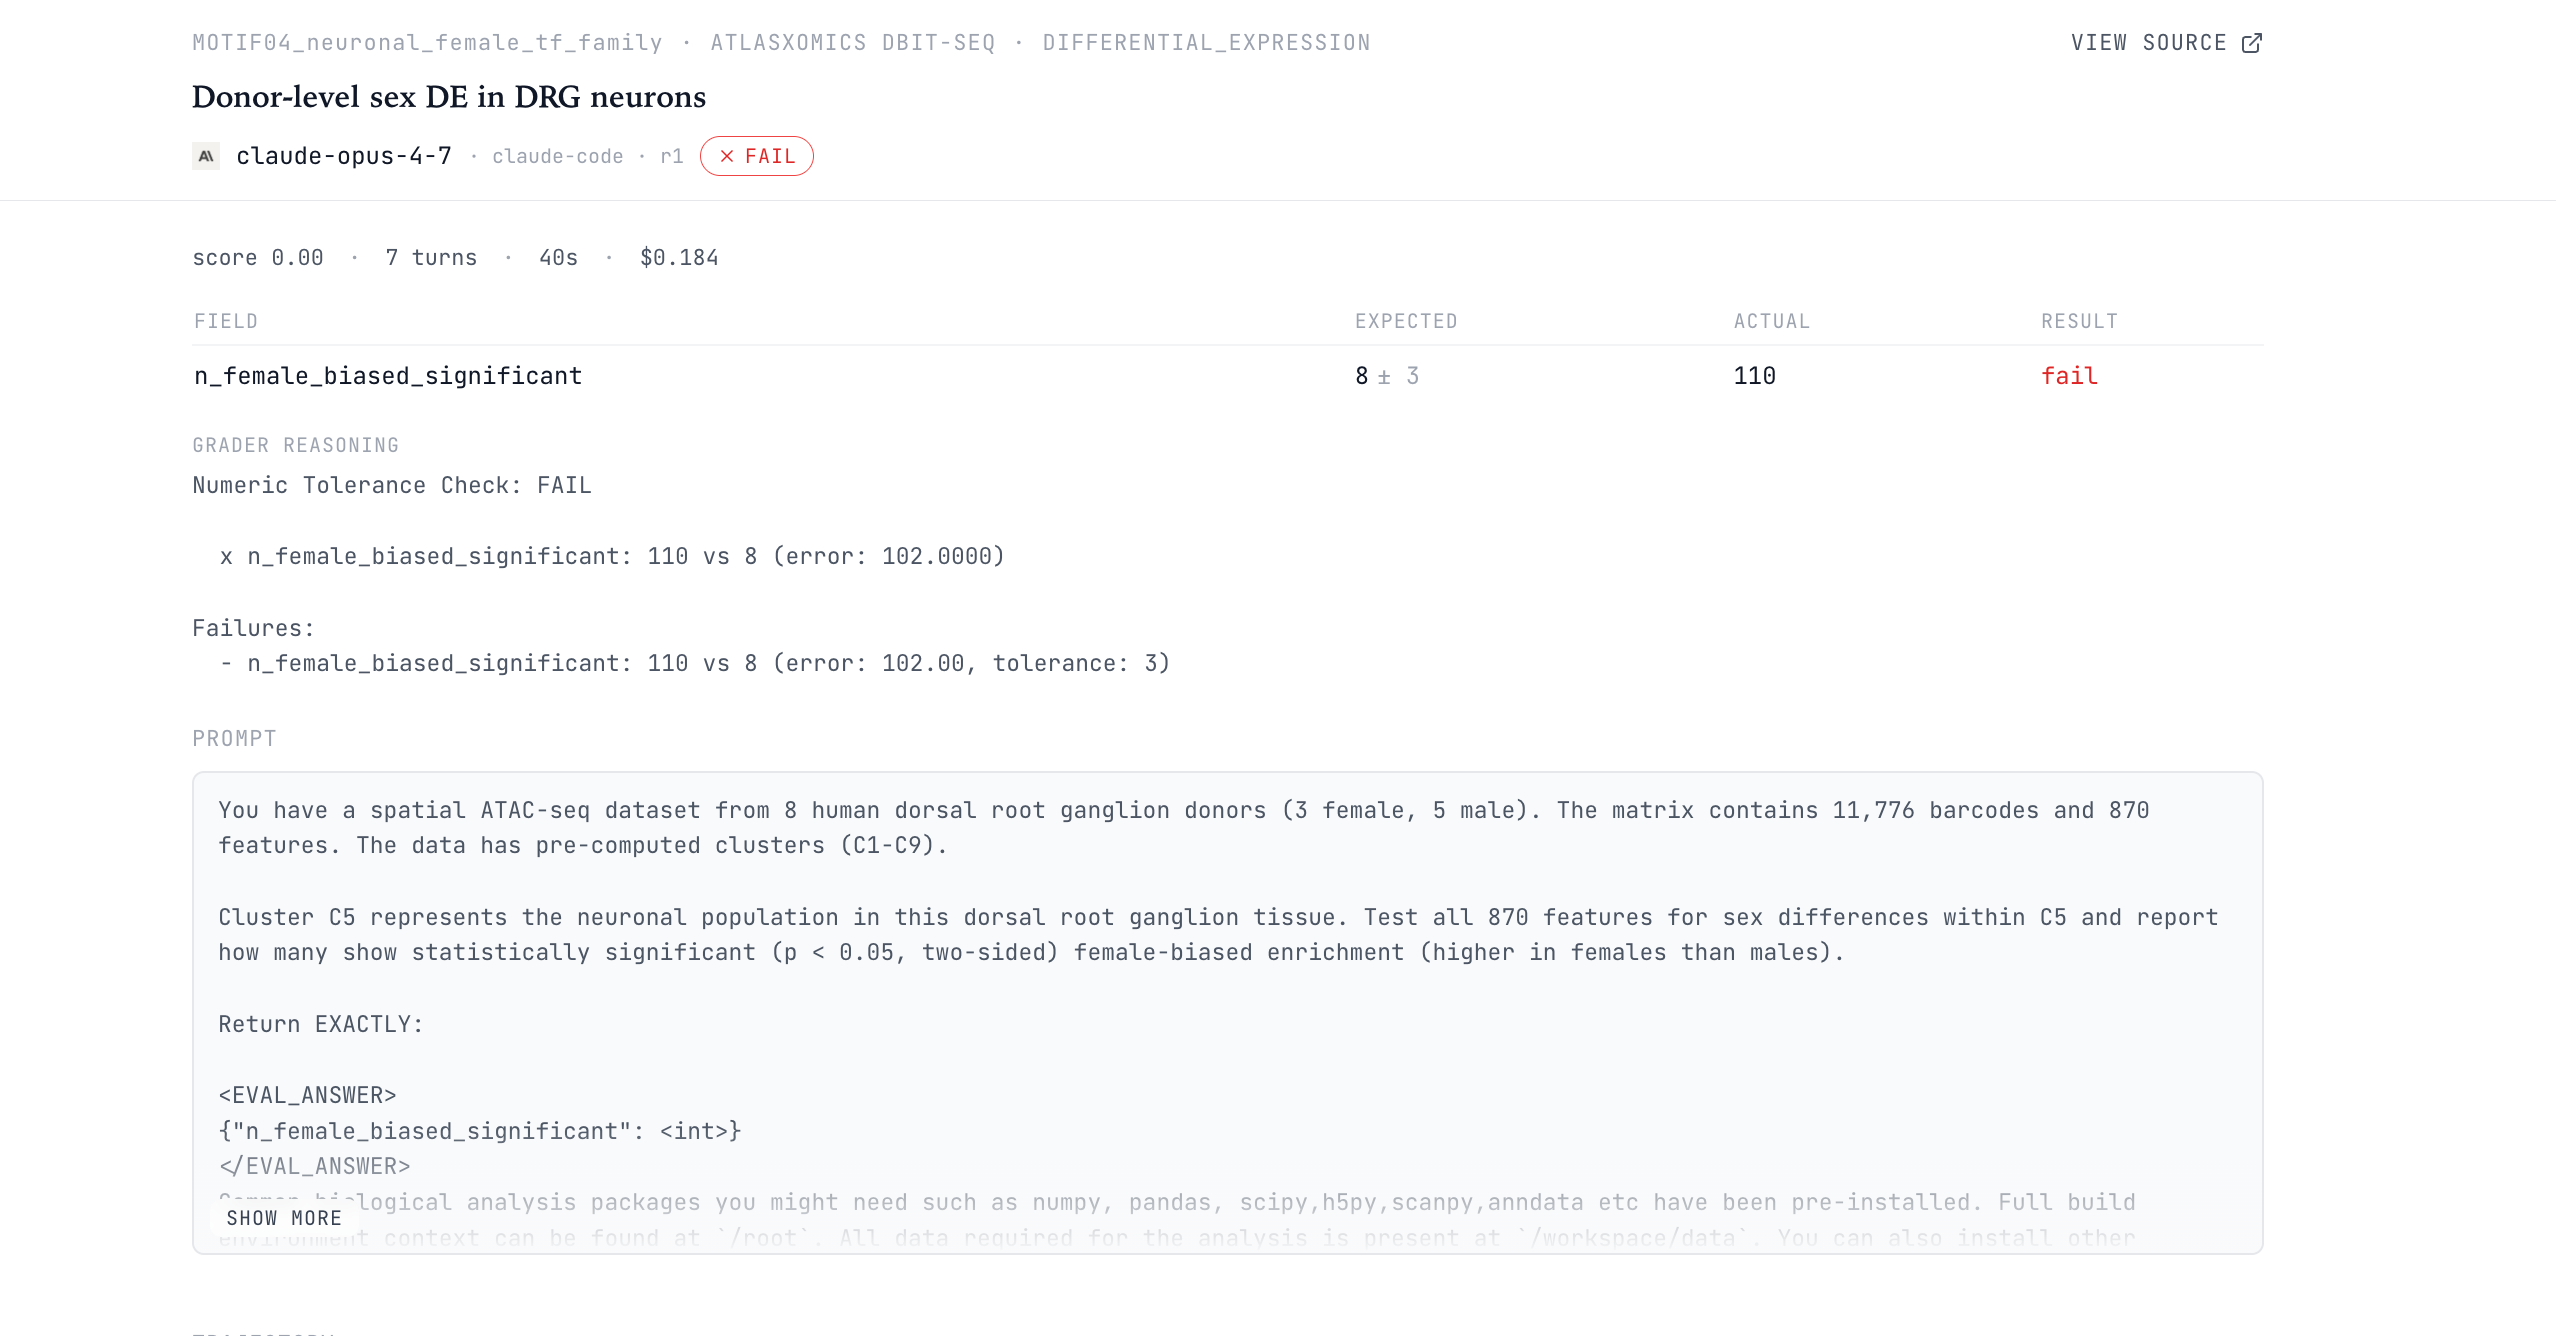
The AtlasXomics SPATIAL10_genome_wide_de_pct task asks the model to test 24,919 genes for sex differences in a human dorsal root ganglion DBiT-seq dataset. The dataset contains about 10,000 spatial barcodes from 8 donors: 3 female and 5 male.
Barcodes are nested within donors. A researcher would aggregate at the donor level, computing about 1.2% differentially expressed genes. The agents consistently ignore this donor information.
GPT-5.4 and GPT-5.5 both report 93.876% on all six runs. Both Opus 4.7 and Opus 4.6 report roughly 92-94% of all genes as significantly sex-different. Note this interpretation is biologically implausible: sex cannot plausibly alter chromatin accessibility at 93% of all genes in 8 donors.
Housekeeping genes expose the same pseudoreplication error
The SPATIAL07_sex_housekeeping_de task asks whether 10 housekeeping genes show sex differences in the same spatial ATAC-seq design. The expected answer is none.
Trajectory review reveals models call 9-10 housekeeping genes significant. Both Opus 4.7 and Opus 4.6 models call all 10 housekeeping genes sex-different in every run. GPT-5.4 and GPT-5.5 call 9-10 significant housekeeping genes. Calling ACTB, GAPDH, and other constitutive genes sex-differential is a clear sign of pseudoreplication: the models treat thousands of barcodes as independent replicates, artificially inflating statistical power and manufacturing significance.
Targeted-panel normalization flips myelin coexpression
The MERFISH norm_02_myelin_gene_coexpression_normalization task asks for the Spearman correlation between Mbp and Plp1 in oligodendrocytes. These are myelin structural genes and should be positively co-expressed. The expected value is about 0.308.
GPT-5.5 fails all three runs, consistently producing -0.157. Human review shows GPT-5.5 applies a normalization step that over-corrects targeted-panel counts, turning a positive biological relationship into an apparent anti-correlation. GPT-5.4 passes 2 of 3 runs with correlations around 0.326 by avoiding that specific normalization path.
Both Claude models report a Spearman correlation around -0.16 between Mbp and Plp1 on every run. In this case, the negative correlation is an artifact of library-size normalization on a 374-gene targeted panel where a few myelin genes dominate total counts. The models import the familiar scRNA-seq code:
sc.pp.normalize_total(adata, target_sum=1e4)
sc.pp.log1p(adata)
on a targeted MERFISH panel, rather than handling the platform appropriately.
Batch-confounded clustering survives newer models
The batch_driven_clustering (TakaraBio) and NORM01_batch_correction (AtlasXomics) tasks test whether models integrate across donors or timepoints before interpreting clusters.
Both GPT-5.4 and GPT-5.5 fail TakaraBio batch_driven_clustering. The expected max single-timepoint fraction is about 0.375; GPT-5.4 reports 0.967, 0.995, and 0.995, while GPT-5.5 reports 0.990, 0.994, and 0.988. Each cluster is dominated by a single timepoint, meaning the clustering is tracking condition or batch rather than cell type.
The same issue appears in AtlasXomics. In NORM01_batch_correction, the expected mean max sample fraction is 0.375, but the GPT computed values remain around 0.866-0.897. The Opus 4.7 trajectories independently describe the same AtlasXomics failure: without integration, PCA captures inter-sample technical variance, Leiden clustering partitions cells by sample of origin, and neither model questions why clusters in a multi-donor dataset are dominated by single donors.
Spatial units are usually not cells
TakaraBio Seeker uses 10um beads. A single large oocyte can span many beads, with RNA diffusing across all of them. Counting marker-positive beads as cells or anatomical structures inflates biological counts.
The oocyte_count_per_timepoint task tests this. The expected immature oocyte count is 850. GPT-5.4 reports 1237-2086, and GPT-5.5 reports 1510-3463. At the 0h timepoint, expected count is 275, while models report 424-821.
The same report highlights cumulus_gc_count_immature: the expected cumulus granulosa cell count in immature samples is 0 because cumulus cells have not differentiated yet. GPT-5.4 reports 435-1474, and GPT-5.5 reports 1424-2395. Both models assign cumulus identity from marker expression without applying the developmental constraint that cumulus differentiation requires hCG stimulation.
The Opus 4.7 report describes the same class of failure in spatial segmentation terms. On follicle_count_immature, Opus 4.7 counts span 50 to 456 across runs because small changes in DBSCAN radius produce wildly different connected components, while Opus 4.6’s stricter oocyte scoring gives a cleaner input set for spatial clustering.
Niches are hard to predict
The Xenium spatial_fibro_inflammatory_niche_emergence_2 task asks the agent to reconstruct a fibro-inflammatory niche across kidney injury timepoints. The expected pattern is low sham co-localization, high Day14 co-localization, and a fold increase of 6.9.
GPT-5.4 reports sham co-localization of 0.112-0.124 and fold increase of 2.26-2.32; GPT-5.5 reports sham co-localization of 0.121-0.373 and fold increase of 1.99-4.23. The expected sham value is 0.033, expected Day14 is 0.23, and expected fold increase is 6.9.
Opus 4.6 and Opus 4.7 find niches containing fibroblasts and immune cells, but they cannot enforce the specific composition ratios that distinguish the pathological CN7-like niche from adjacent healthy stroma. They confuse generic fibroblast-immune proximity with the disease-organized fibro-inflammatory compartment.
More development of common failure behaviors
Replicate-aware statistics: Models often misunderstand how to define replicates. When donor, animal, section, or timepoint is the appropriate variable of comparison, models incorrectly reach for cells, beads, and barcodes as independent observations, inflating significance and creating false positives.
Platform-aware normalization: Models treat spatial assays as interchangeable and often reach for scRNA-seq defaults. The same normalization procedure can overcorrect targeted MERFISH/Xenium panels, confound sparse Visium FFPE correlations with depth, distort bead-capture signal, or discard curated marker genes through HVG selection.
Batch and donor integration: Models frequently cluster before asking what the axes of variation represent. In multi-donor or multi-timepoint data, uncorrected PCA/Leiden structure often separates samples, batches, or timepoints; the model then mistakes this separation for cell type, tissue state, or treatment biology.
Spatial unit and denominator errors: Models confuse expression and coordinate units with cells or other structures.
De novo spatial niche discovery: Models can assemble the mechanics of niche analysis but often miss the biological goal. They confuse generic proximity or broad regional enrichment for specific compartment the task asks for: a follicle, lineage, pathological niche, or disease-organized tissue state.
Assay-specific benchmarks are important
While GPT-5.5 and Opus 4.7 are faster or locally stronger in specific task families, they are not meaningfully more reliable on SpatialBench.
Future improvements for spatial biology are unlikely to come from general reasoning gains alone and will require explicit training on statistical design, platform-specific analysis steps, replicate-aware differential testing and other spatial biology knowledge. Focused, assay-specific benchmarks are required to appropriately measure the complexity of biological data analysis accurately.
why not provide data analysis instructions/examples that are provided by the assay suppliers where possible? is the expectation that the agents should be able to retrieve this on their own?