


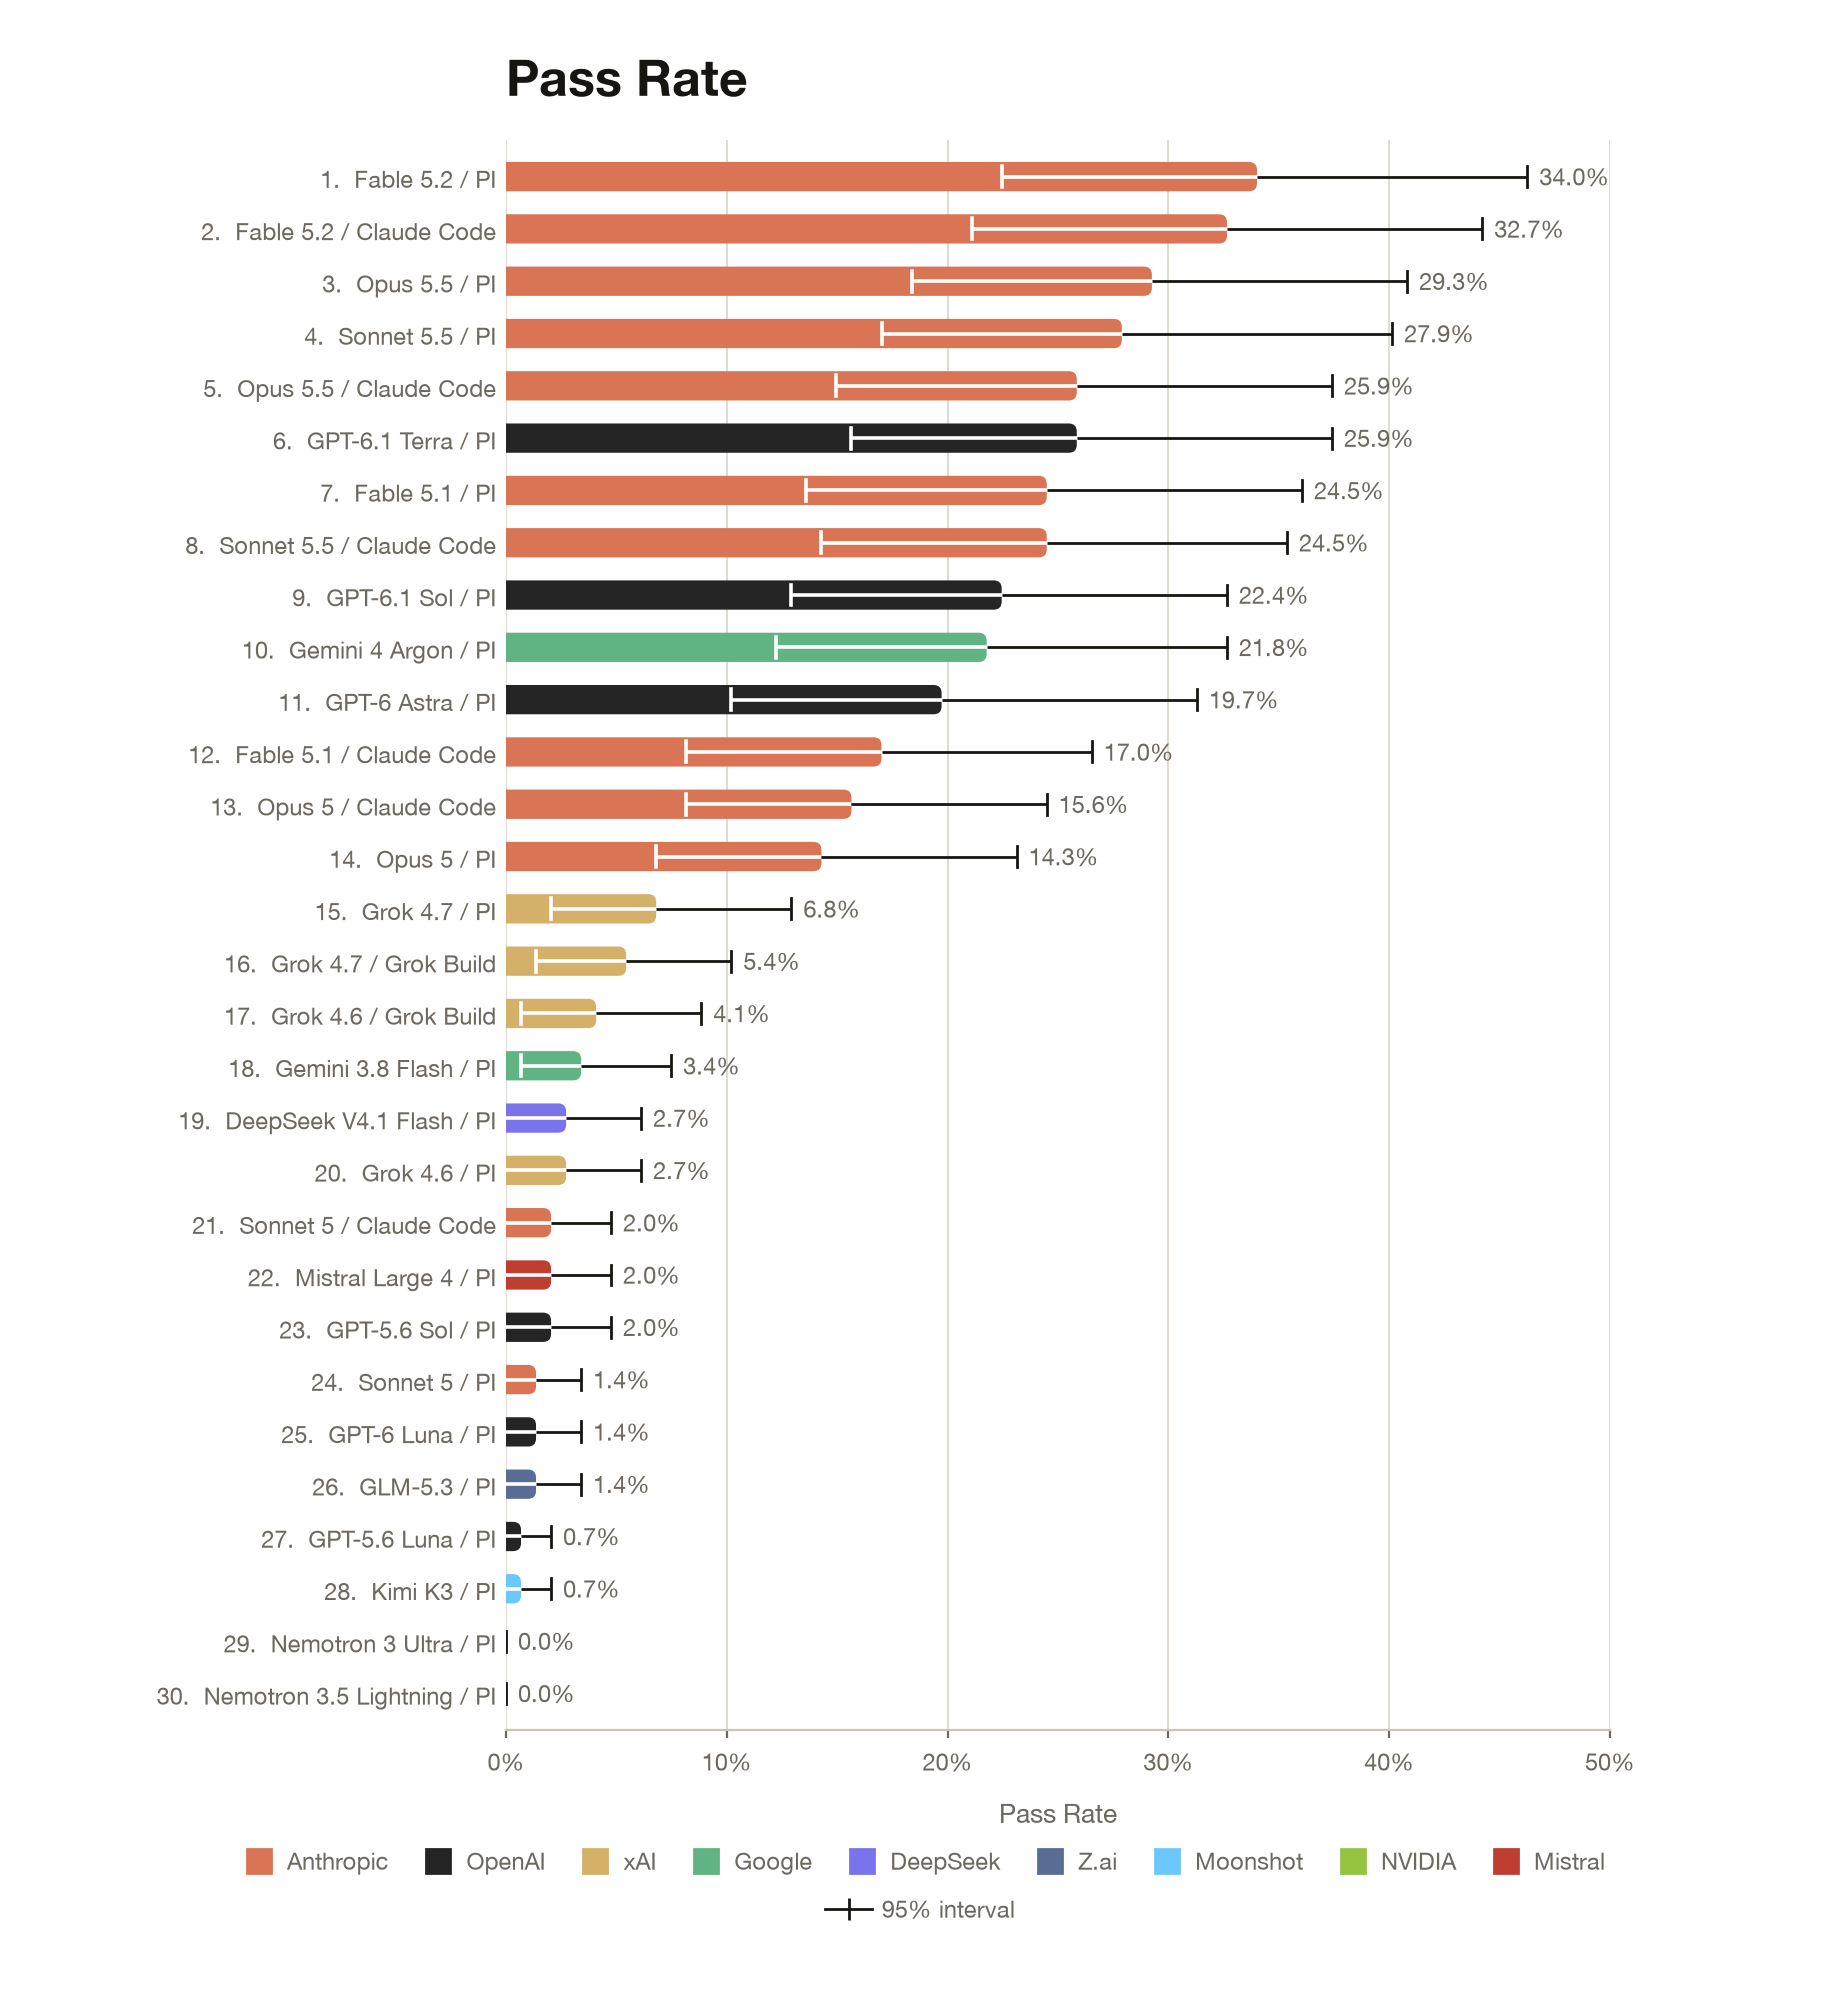
TissueMicroscopyBench is our first benchmark that focuses mainly on the visual capabilities of AI agents. It has 49 tasks from four publicly available datasets, and each task is run in triplicate across every model-harness combination. The highest pass rate was achieved by Fable 5.2 on the PI harness with 34.0%.
Most Important Facts
Agents are challenged by visual recognition and spatial reasoning tasks. Across 4,151 completed runs, only 13.2% passed.
Fable 5.2 was the high performer. Fable 5.2 on the Pi harness performed the best, with a pass rate of 34.0%. Fable 5.2 on Claude Code followed with a pass rate of 32.7%.
Performance varied by task type. In general, agents performed better on identifying large and visually distinct tissue regions (e.g., mucosa, fat). Agents really struggled on identifying small, sparse, or rare structures and on anything requiring tracking or multi-step spatial reasoning (nerves, perineural or lymphovascular invasion, T-cell-rich zones).
Why Tissue Microscopy
Visualization and perception are key to understanding normal tissue biology and disease pathology. The spatial organization of cell types reveals how tissues maintain homeostasis and how this balance is disrupted in disease. Tissue microscopy is how we get to see it.
In research, imaging datasets are abundant and mostly high quality, yet they stay underutilized because in-depth analysis takes so much expert time. Pathologists face the same constraint: large volumes of slices to classify quickly, without compromising quality. AI agents should not make clinical decisions on their own. But they could triage cases, flag regions of interest, and take over routine quantification, which leaves experts more time for harder judgment calls.
Before anyone leans on them, it’s worth knowing where frontier models do well on tissue images and where they fall short. TissueMicroscopyBench tests this across anatomical structure perception and annotation, as well as 3D, spatiotemporal, and treatment-effect reasoning.
The Leaders
We assessed 30 configurations of 22 models under three harnesses (Pi, Claude Code, and Grok build). Each configuration attempted three runs per task. Of those, 259 runs did not end up producing a gradable answer (mostly because of timeouts), which leaves 4,151 graded runs. Of these tested models, Claude models perform best. Fable 5.2 (Pi) passed at 34.0%, Fable 5.2 (Claude Code) at 32.7%, and Opus 5.5 (Pi) at 29.3%. GPT-6.1 Terra (Pi) was the strongest non-Anthropic configuration at 25.9%. Tasks were designed to be challenging. 26 of 49 tasks were solved by at least one configuration, while 23 were never solved.
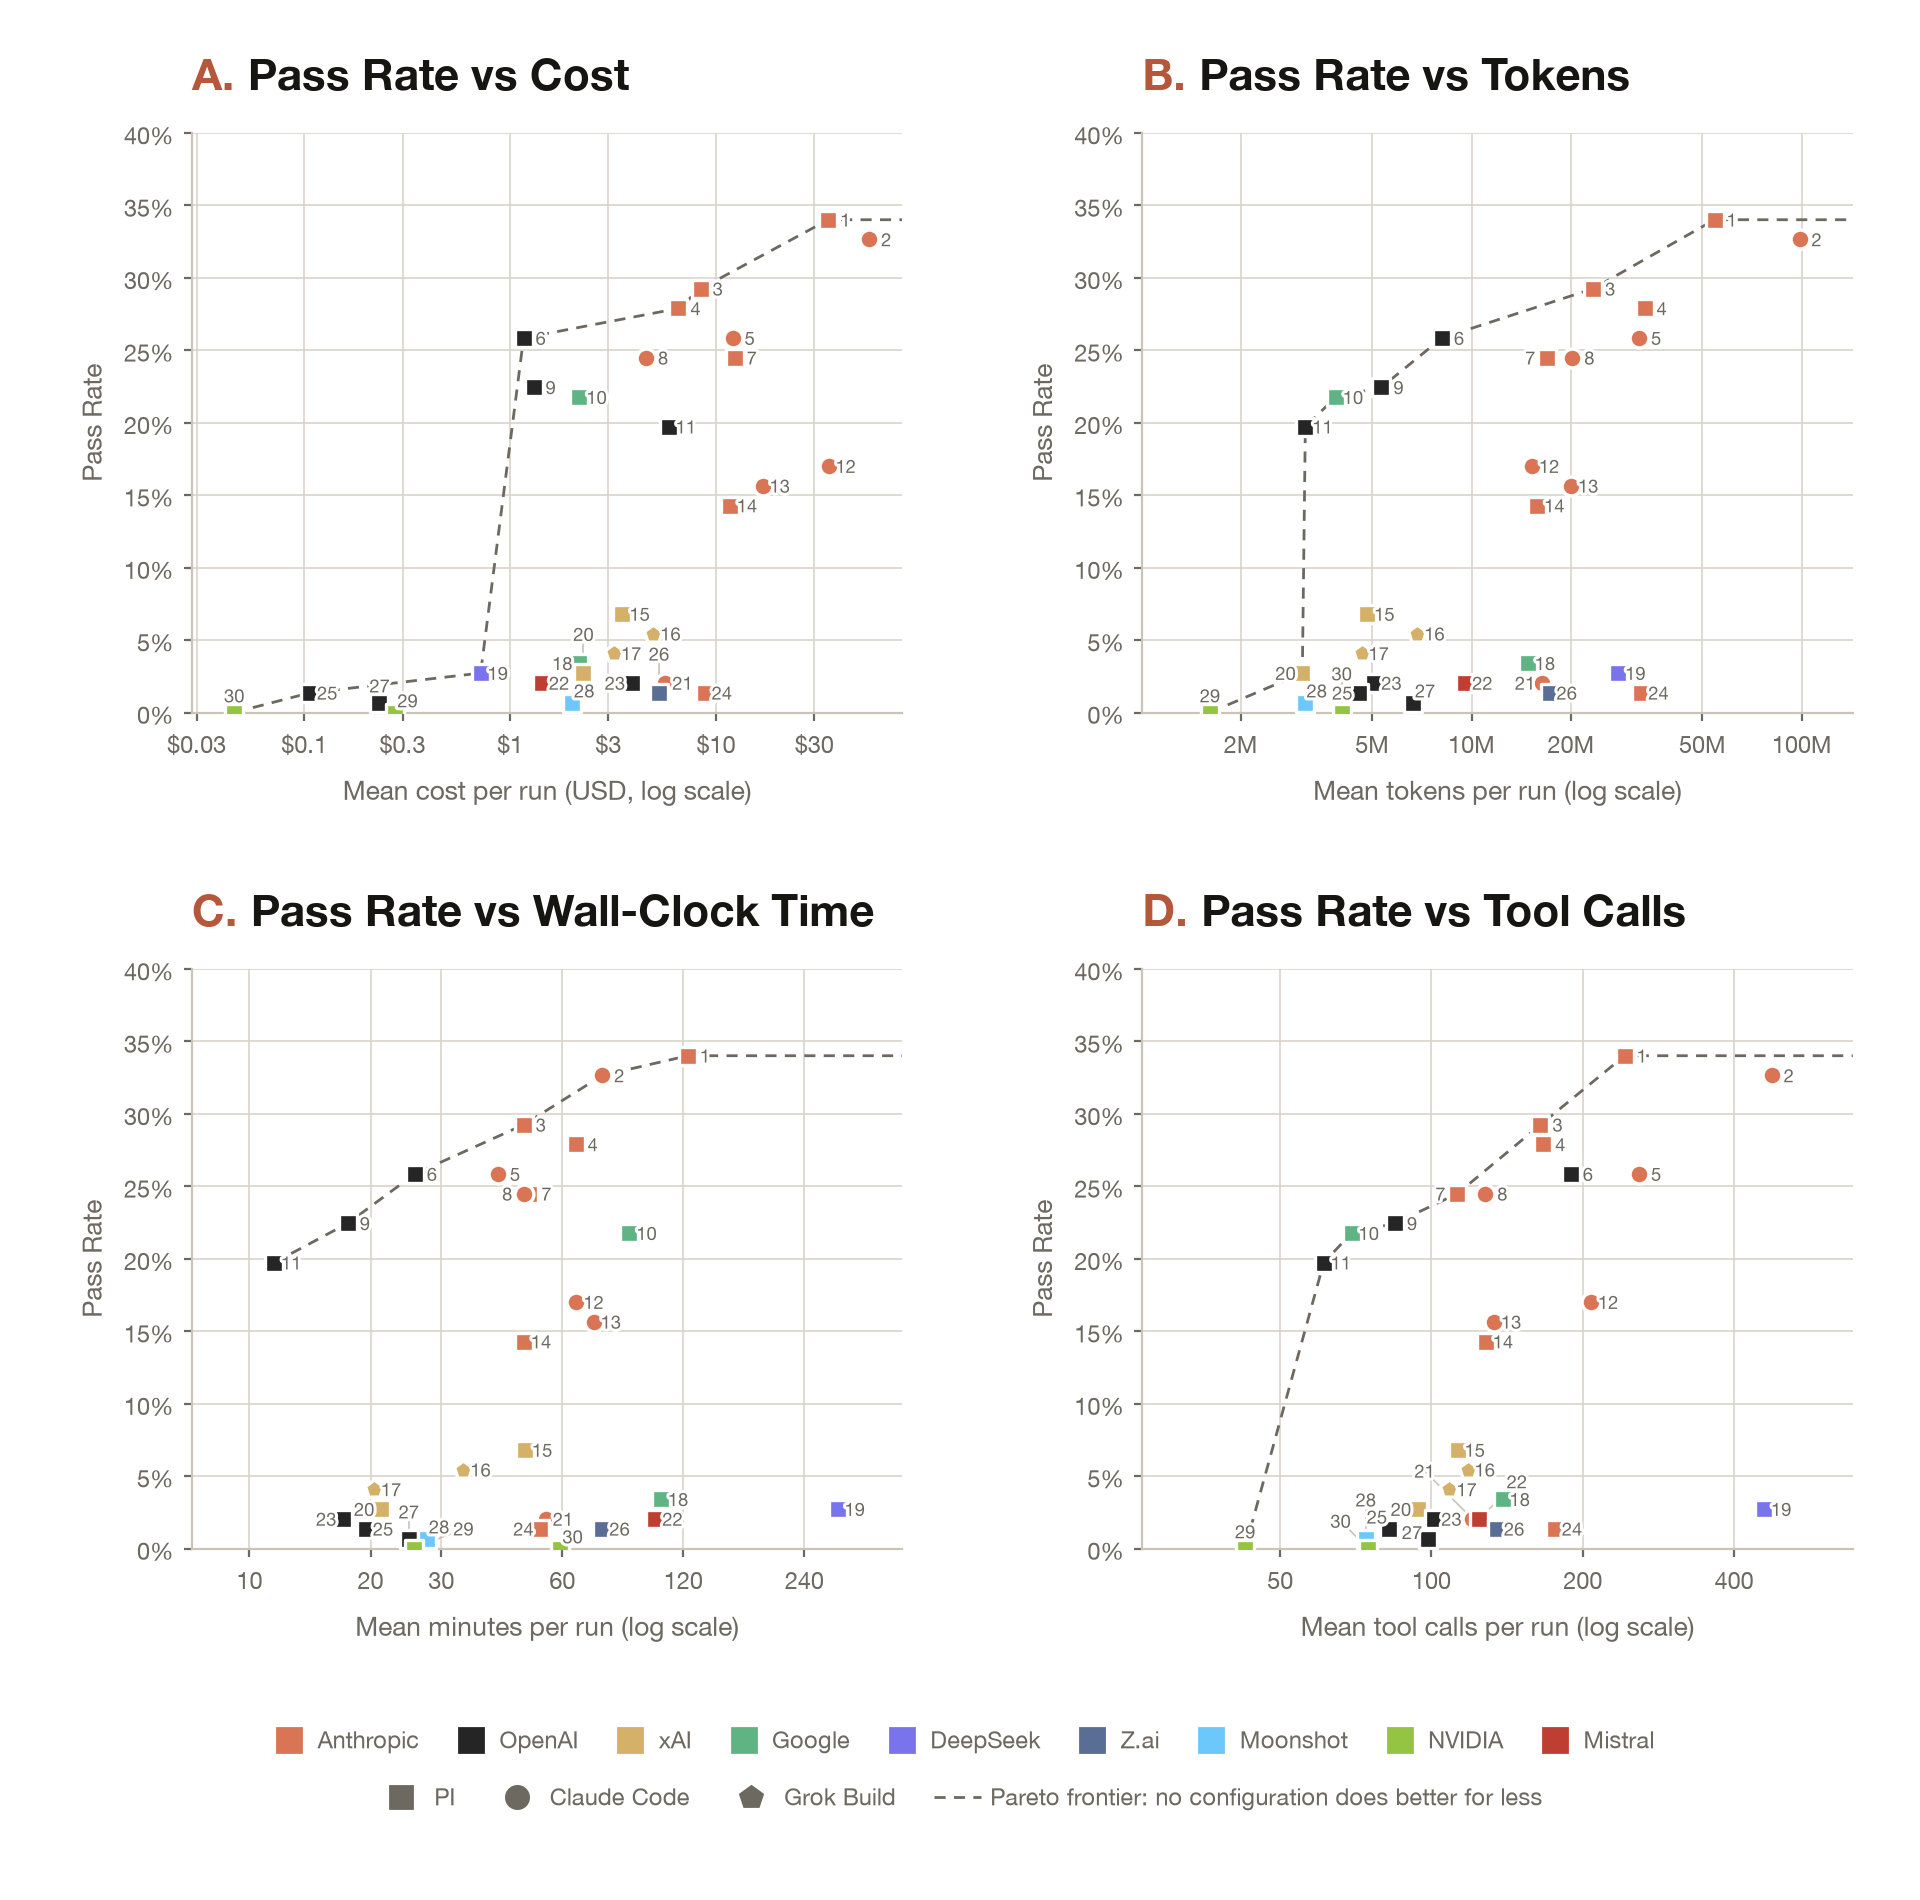
Accuracy rose moderately with cost (Spearman p = 0.61). GPT-6.1 Terra (Pi) passed at 15.9% at about $1.16 per run, while the top configuration, Fable 5.2 (Pi), passed at 34.0% at about $35.07 per run. The most expensive one, Fable 5.2 (Claude Code), cost about $55.42 per run and passed 32.7% of tasks. Agents were also inconsistent. Even Fable 5.2 (Pi), which was the best performing configuration, solved 43% of tasks at least once but only 22% on all three runs.
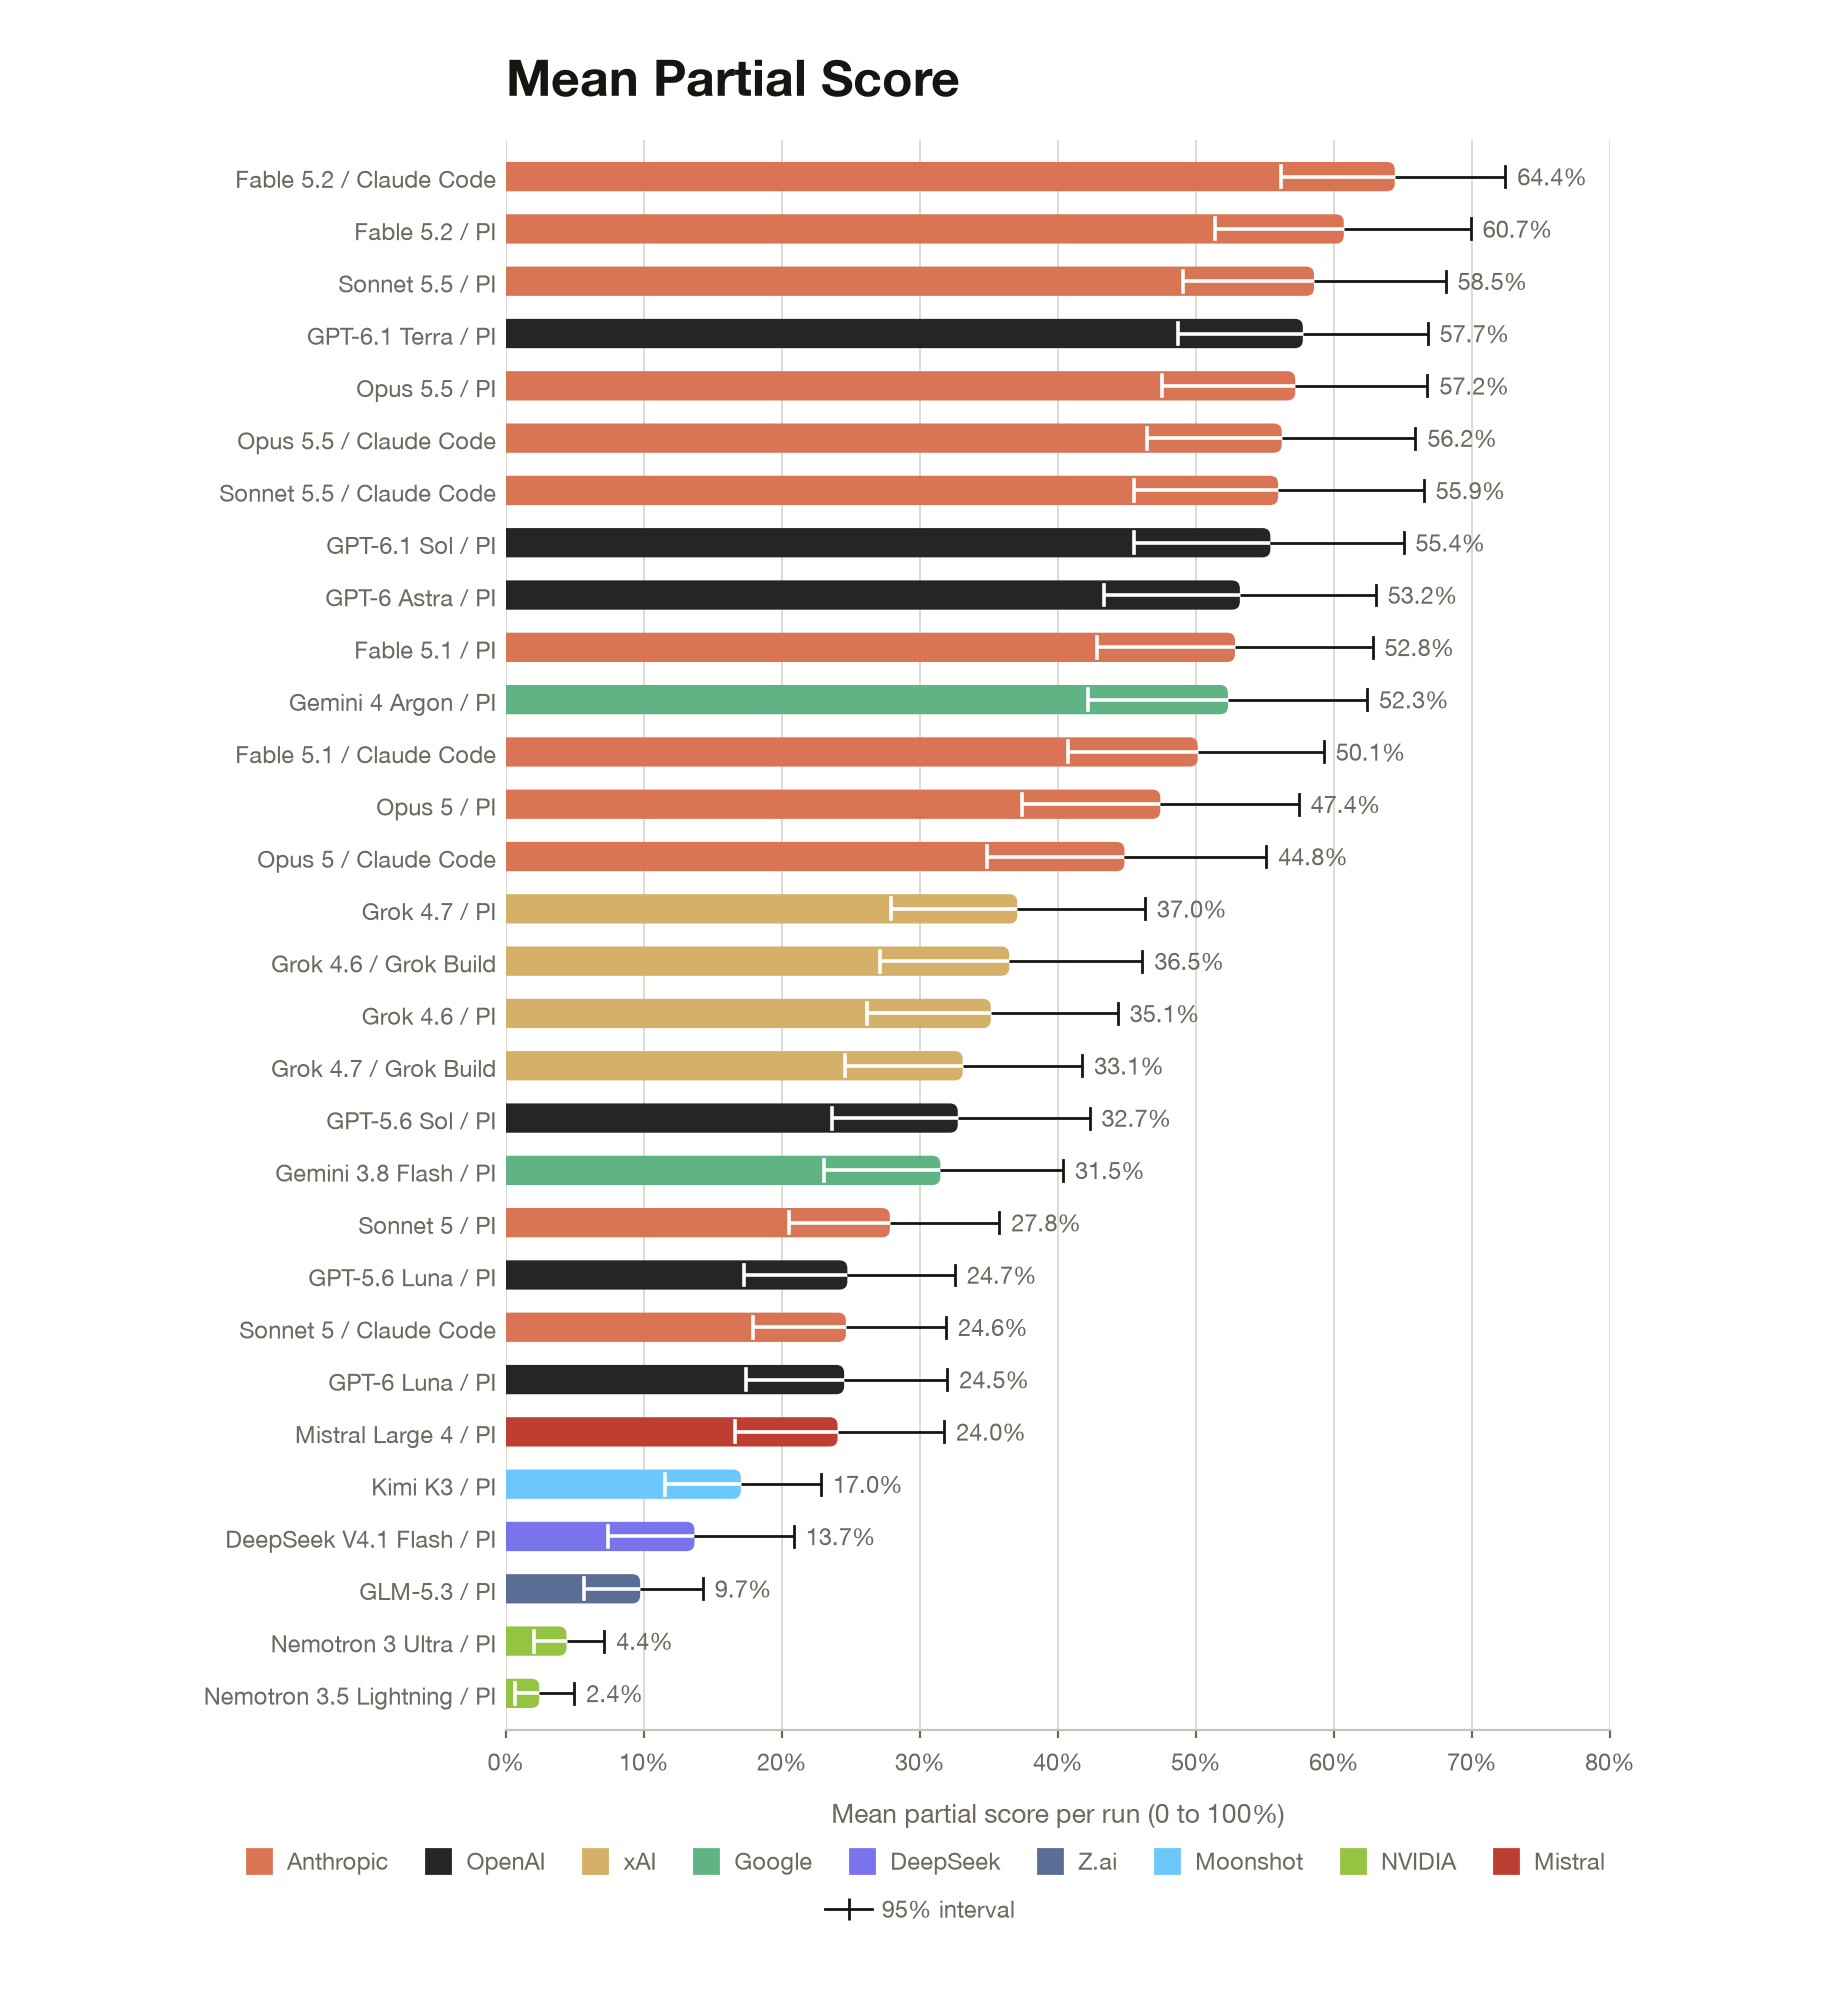
Pass/fail hides how close agents usually get to the answer. So we looked at the average partial score for each agent run. Most of the frontier LLM combinations land somewhere between 52% and 64%, so they usually get a good part of the answer right but rarely all of it.
Design of the Benchmark
We built the 49 tasks on four public datasets. Two are fixed tissue: colorectal cancer sections stained with H&E and multiplexed immunofluorescence, and liver metastasis biopsies taken before and after treatment. The other two are live imaging: light-sheet recordings of organoids and a 3D time-lapse of a regenerating leg. The tasks span anatomical structure perception and annotation, 3D, spatiotemporal, and treatment-effect reasoning. Most of the tasks are focused on anatomy. In every task the agent gets the images and has to come back with a location, an outline, a track, or a 3D volume. We compare against an expert annotation of the same image. As disagreement between experts is usually high, we had every task verified by a human. An expert was given the task in the same setting as an agent and had to solve it. When a task did not pass that check on the first try, we went back, worked out what the problem was, and changed the task in a way that stays fair and scientifically sound.
A lot of image recognition is challenging to push into programmable rules, and we designed most tasks around exactly that. An agent can generate candidates with code, but purely computational approaches would not get it all the way to the right answer. The agent needs to utilize its visual capabilities and make the specific call. Early on we also experimented with providing agents with specialized image analysis/segmentation tooling, but in most cases this doubled execution time and cost without meaningfully improving pass rates or scores. Because of these results, the current working environments do not include these tools.

How Agents Work and Their Performance
Most runs follow the same schema. The agent writes code to find candidates, renders them, looks at them, and keeps what seems right. The weak spot is the first step, because anything the code never picks up never gets looked at. So agents tend to be right about what they mark but miss a lot of what’s actually there.
The loop also takes a while. The best setups make somewhere between 160 and 480 tool calls per task and run for half an hour to two hours, and with images this large, they fill their context quickly. Most of the context filling up is the agent looking at the images. The top-performing LLMs go through roughly 8 to 100 million tokens per task, with over 99% of this being their context that is reread, against only 50k to 300k tokens of generated output. Across all runs, about 151 timed out before being able to submit an answer.
To get a feel for what that looks like, we went through ten runs of the top Anthropic and OpenAI setups (Fable 5.2 and GPT-6.1 Terra) on the anatomy tasks. In a typical run the agent looked at around 110 images, which comes to about 70 MB of image data in total, with each image being only a few megapixels. So at any one time agents see either a small window or a heavily downsampled view of a slide that can have billions of pixels. Most of their annotation comes from segmenting the whole slide with code and extracting candidates for the requested structure. Where they’re unsure about the outline, they try to patch it by hand.
The following two examples show where this way of working falls short.
Anatomy
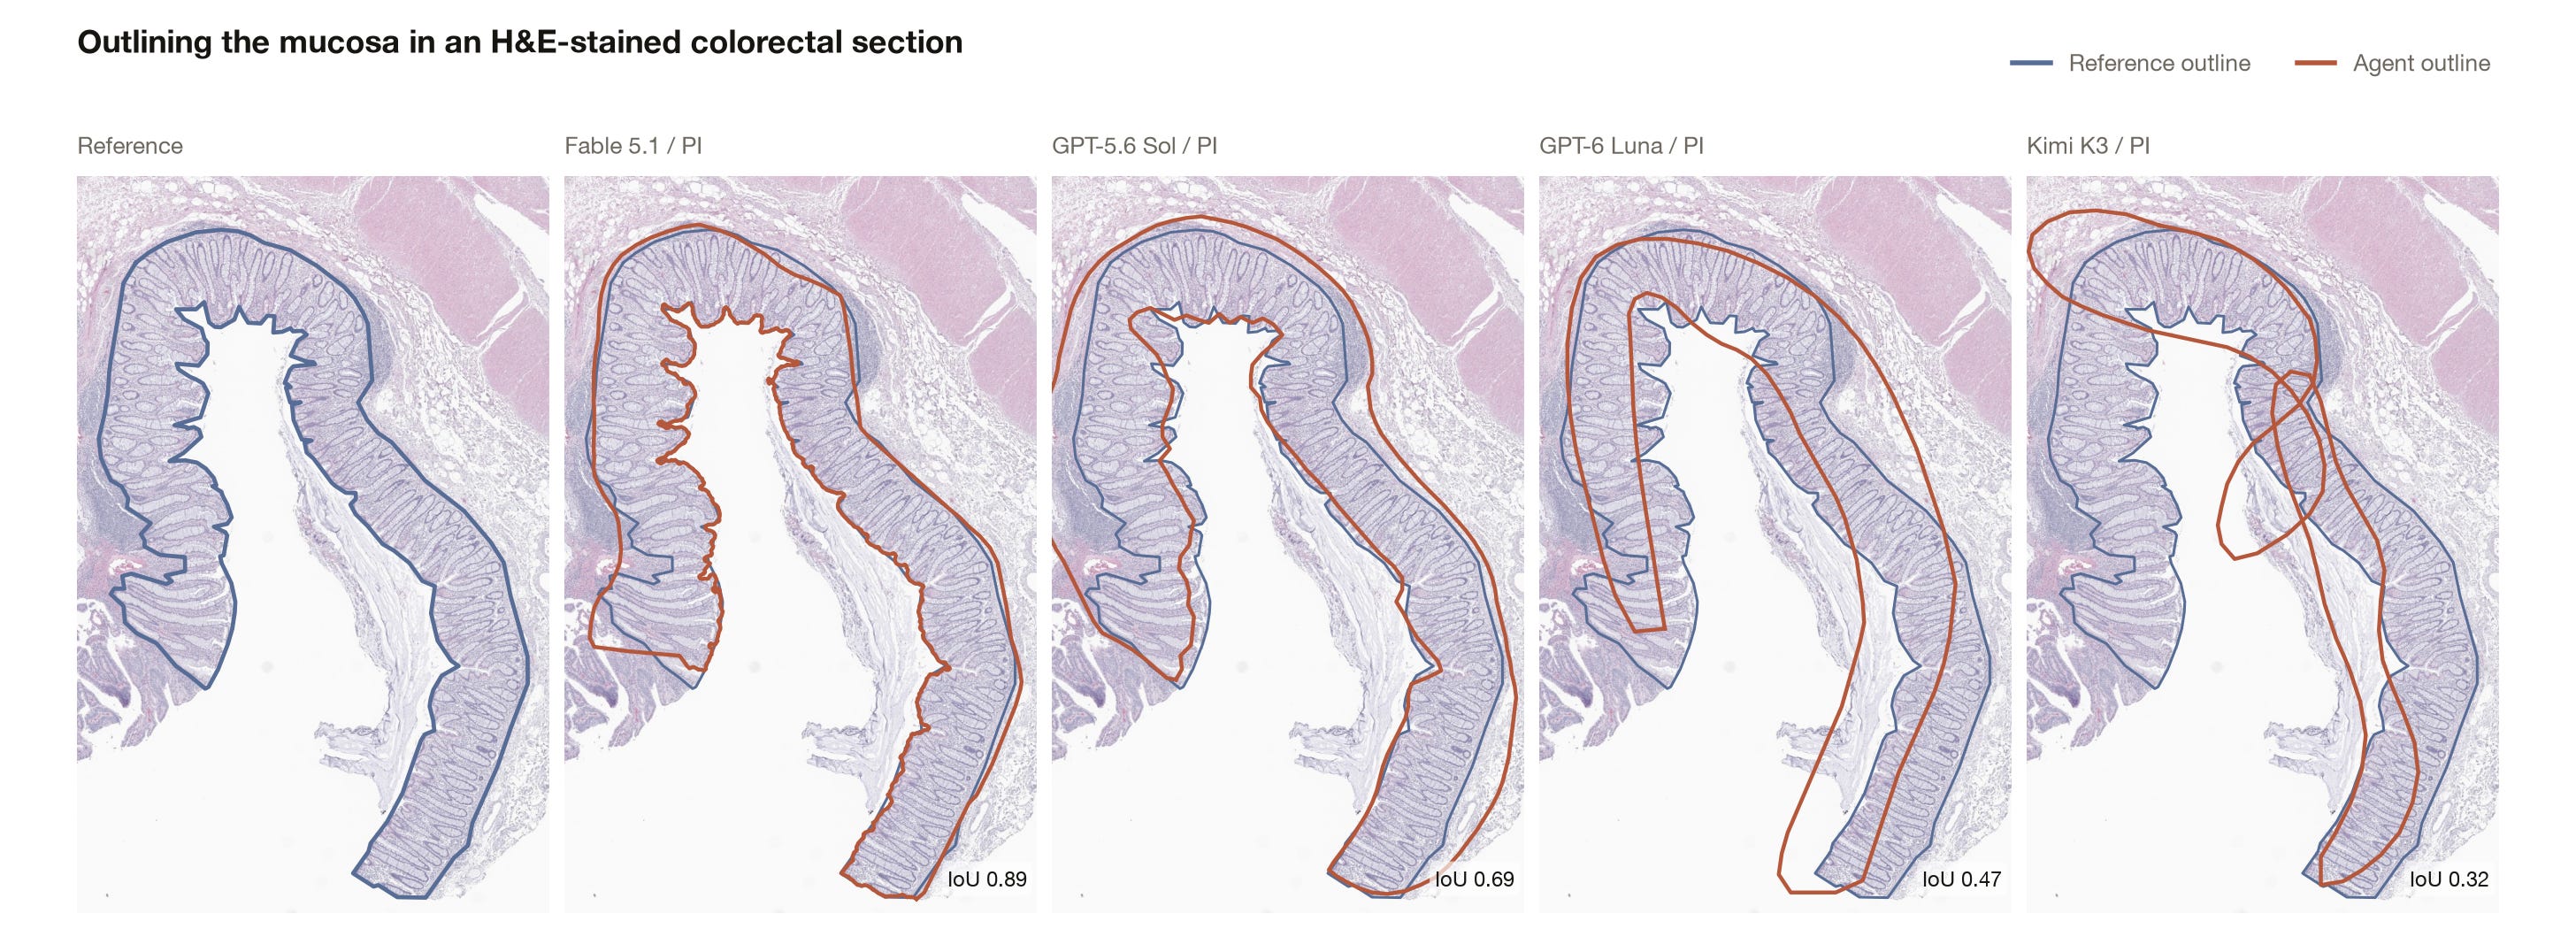
Take a task that asks for the intact mucosa on a slide. The mucosa is a large, distinct structure that’s easy to spot when looking at the image, but across the mucosa tasks only about a quarter of all runs passed. When a run fails, it’s mostly not a near miss. The agents don’t recognize the structure and its full extent. In the example below, every agent found roughly where the mucosa is, but only the first recognized its extent and outlined it reliably. The others draw rougher shapes over approximate locations, including surrounding tissue, empty space, or leftover material from tissue preparation, none of which is part of the mucosa.
Spatiotemporal perception
One of our spatiotemporal reasoning tasks asks the agent to follow what happens over time in a light-sheet recording, in this case where a cell moves over time and through different z-slices in a regenerating tissue. Most runs start on the right nucleus, but they are unable to follow it. For some of the six cells in the task, half of the runs already lost it after 1-2 frames, and by the end, only about half to three-quarters are still on the right cell, with plenty of agents drifting off and finding their way back in between. Although this task was not included in the final benchmark, it still demonstrates quite well where things go wrong and how demanding this still is for agents.
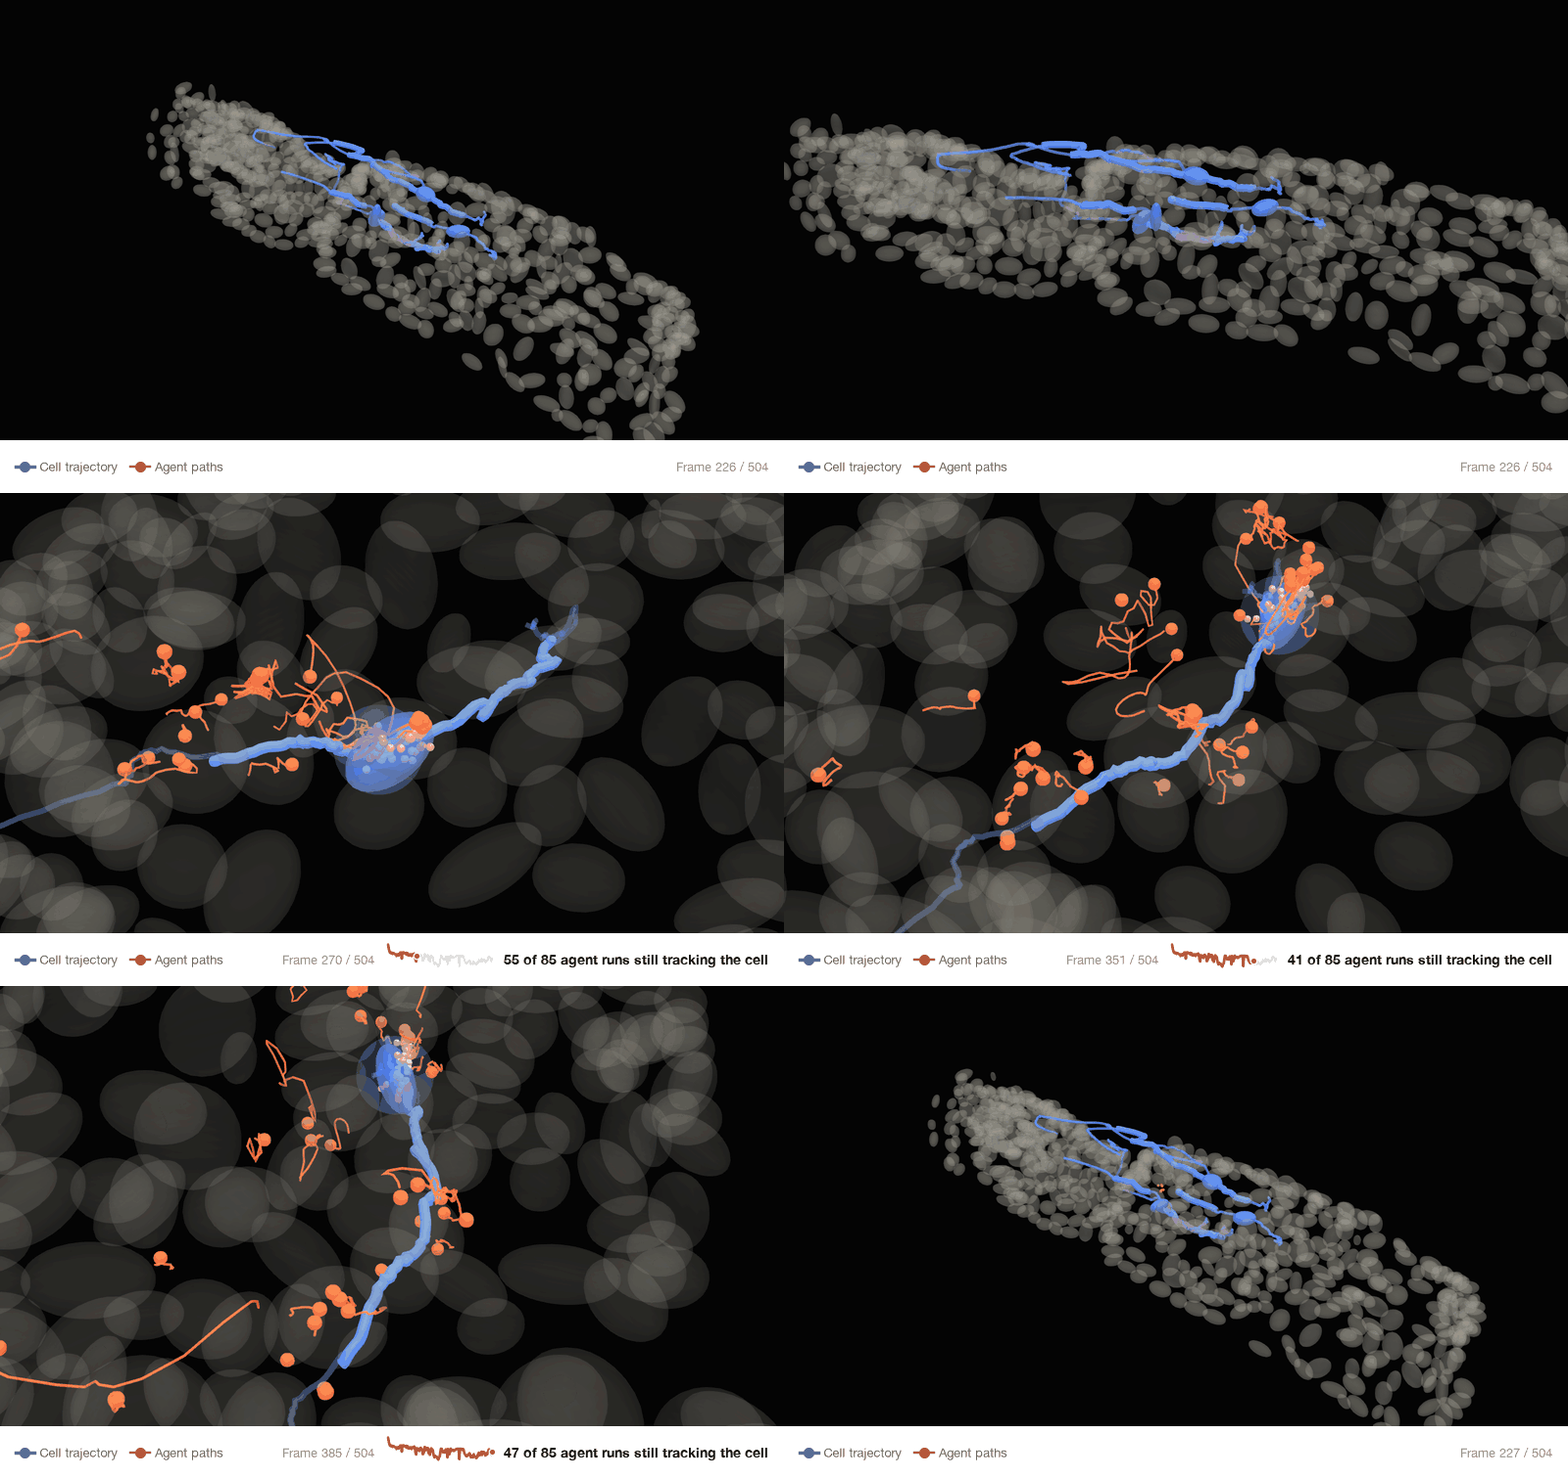
The four spatiotemporal tasks that we included in the benchmark were hard for every model. Only 14% of all runs passed, and two of them were never fully solved. Opus 5.5 did best here, passing half of its runs on both Pi and Claude Code, ahead of Fable 5.2.
Sonnet vs Opus and Terra vs Astra
These two comparisons stood out to us. Sonnet 5.5 came very close to Opus 5.5’s performance. On Pi it passed about 27.9% of runs against 29.3%, and the two got the same number of passes on 33 of 49 tasks. The one place they clearly split was spatiotemporal reasoning, where Opus passed half its runs and Sonnet a quarter. The also got there differently: Sonnet used about 40% more tokens and also ran a third longer than Opus but still came out cheaper per run ($6.57 vs $8.42).
On the OpenAI side, GPT-6.1 Terra beat GPT-6 Astra (25.9% vs 19.7%), and it did that by putting in a lot more work. Terra made about three times as many tool calls per run (189 vs. 61) and ran more than twice as long (26 vs. 12 min), yet cost a fifth as much ($1.16 vs. $5.88). Astra tends to do a lot less before it answers. Terra was better on 10 tasks and Astra on 2; nearly all of Terra’s runs were on anatomy tasks.
Conclusion
Agents handle large, obvious structures well but miss what their code never picks up, don’t follow real borders, and overlook small or faint things. Recognizing a structure and placing it precisely turned out to be two separate skills, and image data eats their context fast. These aren’t questions where analysis based on thresholding would allow you to answer the task, and for now it appears that agents still lack this specific ability.
TissueMicroscopyBench covers a focused subset of tissue microscopy for now, and we plan to keep expanding and maintaining it. Our hope is that it becomes a useful resource for pathologists and researchers deciding where to trust an agent, and for model developers deciding where to improve.
At LatchBio, we build benchmarks to measure how well AI agents analyze real biological data. If that sounds interesting, we’re hiring.