
GPU peak calling for epigenetics
A deep dive on an important algorithm for ATAC/ChIP-seq analysis // an accelerated implementation with ~15x speed improvements


Peak calling is an important algorithm for the analysis of epigenetic data. However, current implementations are not keeping pace with the increasing volume of sequencing data. This step can be rate limiting in end-to-end research workflows, especially with the growing popularity of single cell and spatial ATAC/ChIP-seq assays.

We present an accelerated implementation of the MACS peak calling algorithm written with cupy on NVIDIA GPUs. We’ll walk through the high level steps of the algorithm to motivate an array based implementation and present benchmarks of the new tool.
Why peak calling is important
Assays that measure epigenetic state are important for basic research and drug development alike. They uncover modifications to the genome that change gene expression and are necessary to fully understand cell development, differentiation and disease mechanisms.
Two such assays, ATAC-seq and ChIP-seq, selectively sequence regions of the genome with unique epigenetic signatures. ATAC-seq measures chromatin accessibility, while ChIP-seq identifies protein-DNA interactions. They produce files of short sequencing reads that must be aligned to a genome. These aligned reads are then analyzed to identify significant regions (“peaks”) that represent either accessible chromatin (ATAC-seq) or protein binding sites (ChIP-seq), often in comparison with a control.

Along with alignment, peak calling represents a major component of downstream analysis. As single cell and spatial assays become more widespread, capturing epigenetic information at 10 micron resolution (and shrinking), these computational steps are slowing down research cycles.
MACS3 is a popular analysis tool
MACS (Model-based Analysis of ChIP-Seq) is the gold standard for epigenetic analysis and includes tools for both alignment and peak calling. It was originally developed in 2008 by Zhang et al. at the Dana Farber Cancer Institute, but has gone through two major rewrites since then - improving performance, expanding features and adding support for Python 3. It is a great tool that has helped many scientists understand their data.
However, despite these improvements, the software was not designed to handle the scale of ATAC-seq data many researchers analyze today, leading to very long runtimes. Rewriting the core algorithms of MACS for GPUs leads to large runtime speedups. While we are also exploring alignment, peak calling is a large and important constituent that will be the focus of this essay.
Understanding a peak calling algorithm
The MACS3 algorithm is a simple series of vector operations. It is easy to understand, especially with visual aids, and this will help motivate the GPU implementation.
1/ Create a histogram of genomic intervals
ChIP-seq produces intervals of chromatin accessibility, each defined by a beginning and end coordinate on the genome.
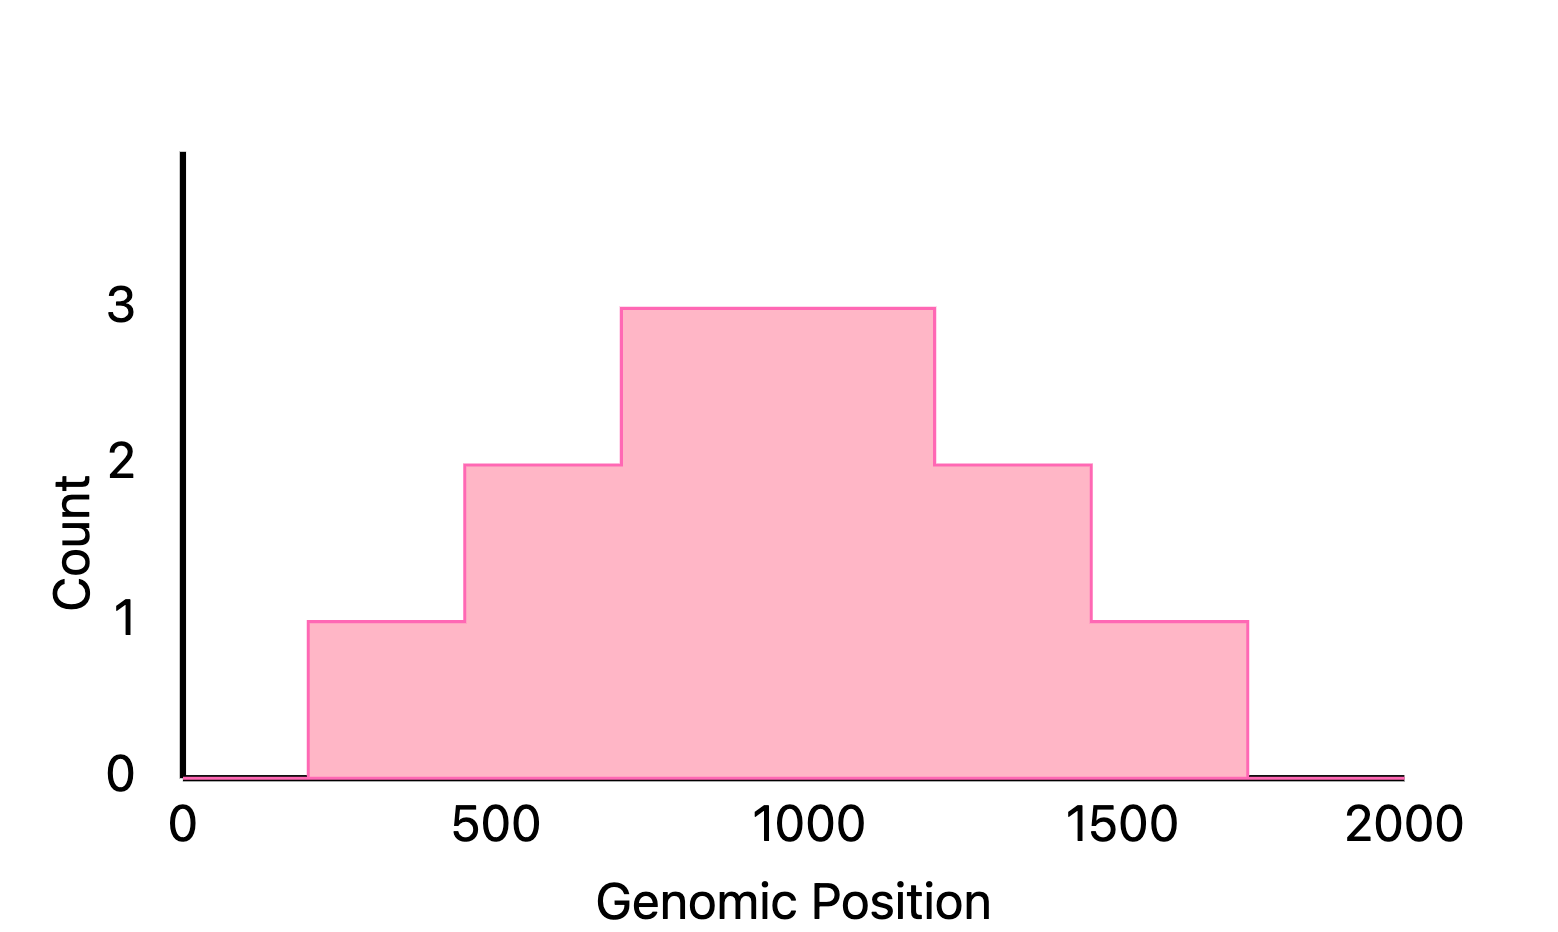
The first step is to construct a pileup that stores the number of overlapping intervals for each nucleotide position. This constitutes merging a large array of intervals: pairs of numbers defining beginning and ending coordinates.
2/ Run a statistical test between treatment and control pileups
The next step is to rigorously identify the locations that are statistically meaningful between two conditions.
The pileup data gives us a number at each genomic coordinate that is some measure of epigenetic signal. We want to compute a p-value for each of these numbers to represent the likelihood it is “explained” by the control. This calculation ends up being a single probability function call - the value of a poisson CDF - applied over a large array of values. The math behind this is elegant and worth investigating.

Because we are testing thousands to millions of genomic positions, some of these tests will be positive by chance. We adjust our p-values to “control” the number of false positives and move forward with “q-values” that are generally a little larger than the p-values.
3/ Find peaks
Peaks are the locations that have high q-values. These are genetic sites where the treatment differs meaningfully from the control.

In practice, we just look for numbers in an array that pass a certain threshold.
4/ Merge peaks
Peaks are initially defined for each coordinate. Contiguous stretches of peaks are merged to produce blocks that are easier to reason about.

This is just a vector operation that searches for thresholded values with adjacent coordinates in an array.
5/ Filter peaks
Small contiguous stretches of peaks are likely artifacts of the experiment and lack biological meaning. We use some size threshold to filter them out so we only have large chunks.

Once again, this is a vector operation that looks for intervals of a certain length.
6/ Locate peak summits
For each contiguous stretch, we find the location with the highest score.

This is yet another vector operation that finds the max value in an interval of coordinates.
As you can see, this algorithm is largely a series of vector operations with a single probability function. We can rewrite it using parallel array operations with an efficient GPU implementation to significantly improve performance.
GPU Implementation and Benchmarks
We used cupy, a Python library of Numpy-compatible GPU array operations, to implement the algorithm. It reads and writes like numpy and is incredibly easy to develop with. Our cupy implementation of MACS3 (gmacs) is available here.
The following benchmarks and figures are produced from a ~1B read scATAC-seq dataset. The “clusters” are leiden annotations produced in standard single cell analysis flow and are used to partition the data for benchmarking.
Runtime
We see a ~14x improvement in runtime between gmacs and MACS3 on average. The largest cluster shows a 15x improvement. These gains come from a combination of faster peak calling and data structure load time.
To speak to the load time gains, MACS3 creates tables that preserve genomic coordinates of the reads and computes a pileup across the genome. This method works well when the data is sparse but modern assays have greater coverage and produce denser data. Instead, we use a cupy array to compute the pileup as we load data into memory, allowing for a single pass through the data - exploiting memory locality and removing intermediate data structures.

Interval Overlap
For autosomal chromosomes, 98-99% of called peaks overlap between gmacs and MACS3.

Note that an “overlap” only requires intervals to share a single position and could lead to little meaningful concordance. We also confirmed that the percentage overlap of the intervals was high - ~99% for each cluster.

A small fraction of intervals had multiple mappings or had no mappings. The percentage of both cases in each cluster was low.

Peak length Overlap
We also were interested in the concordance of peak length (distance between the end and start coordinates) for each interval.

We compared the length of the peaks between the two tools and found a very strong correlation (Pearson's r = ~0.98).
Overall, the tool shows strong performance improvements. We have been able to reduce peak calling steps from a few days to a few hours with industry biotech teams.
Peak calling is one component of a complete GPU workflow
As data generation in biology continues to grow, our team believes existing bioinformatics code will be rewritten for GPUs over the next decade. A single cell ATAC-seq workflow has multiple algorithmic steps that would benefit from a rewrite. While we see impressive results from GPU-based peak calling and sequence alignment on industry workloads, especially in combination, there are other steps that need attention. Motif deviation and annotation lack GPU implementations.
I/O is also becoming increasingly important, especially shrinking algorithm runtimes increases the proportion of time spent moving data to and from storage devices. Persistent data structures (like anndata) have disk layouts that can be exploited with well engineered access patterns. Modern storage devices with single digit nanosecond latencies can be deployed and managed at scale for many companies with the rise of managed computing platforms, like Latch.
Our engineering team will continue to build fast bioinformatics tools and infrastructure to keep pace with the exciting improvements in new assays. We invite collaborators and are especially interested in working with solution providers developing new assays.
 | A guest post by
|