
Landscape of Sequencing-based Spatial RNA Technology: Part I
A review of sequencing-based spatial transcriptional assays: the history, technology tree, 6 companies + 14 products.

A true understanding of biological systems requires the geometry of cell interaction. Traditional transcriptomics methods, such as single-cell and bulk RNA sequencing, lack this spatial context.
The emergence of NGS-based spatial RNA measurement tools has transformed our ability to visualize gene expression directly in situ. Unstructured gene expression datasets transform into structured, interpretable tissue blueprints with rich biological information.
In the past decade, 20+ companies have emerged to bring commercial spatial solutions to market, such as 10X Genomics (Visium), Curio Biosciences (Slide-seq and Slide-tag), Complete Genomics (STOmics platform), AtlasXOmics (DBiT-seq). At least 6 of these companies use sequencing-based methods alone.
This article is the first installment in a series investigating different “branches” of spatial technology. We begin by introducing a technology tree and public database to organize methods, products and companies.

From there, we take a closer look at the sequencing-based technology branch in detail, looking at core concepts, methods by history and methods by attributes.
Please see this table of content to see the overall structure of the article and quickly jump to the part you’re interested in:
Solid-phase capture spatial indexing by history
2019: Solid-phase spatial indexing commercialized by 10X Genomics’ Visium
2023: Curio Biosciences commercialized Slide-seq V2 with Curio Seeker.
2022: Emerging technology, Stereo-seq, with sub-micron resolution
Stereo-seq Isn’t Alone: The Rise of Sub-Micron Spatial Transcriptomics
October 2024: seqScope repurposes Illumina’s flow cells (Academic method, not commercialized yet)
Technology Tree
High-throughput spatial profiling technologies can be divided into two umbrella categories: sequencing-based and imaging-based methods.
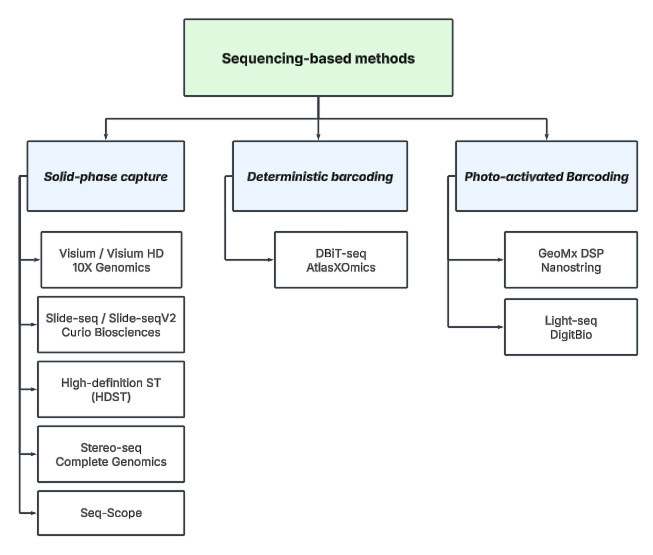
To help navigate these groups and contextualize their various branches, we’ve constructed a “technology tree”. For further exploration, we refer the reader to this online database to browse and filter technologies by different properties.
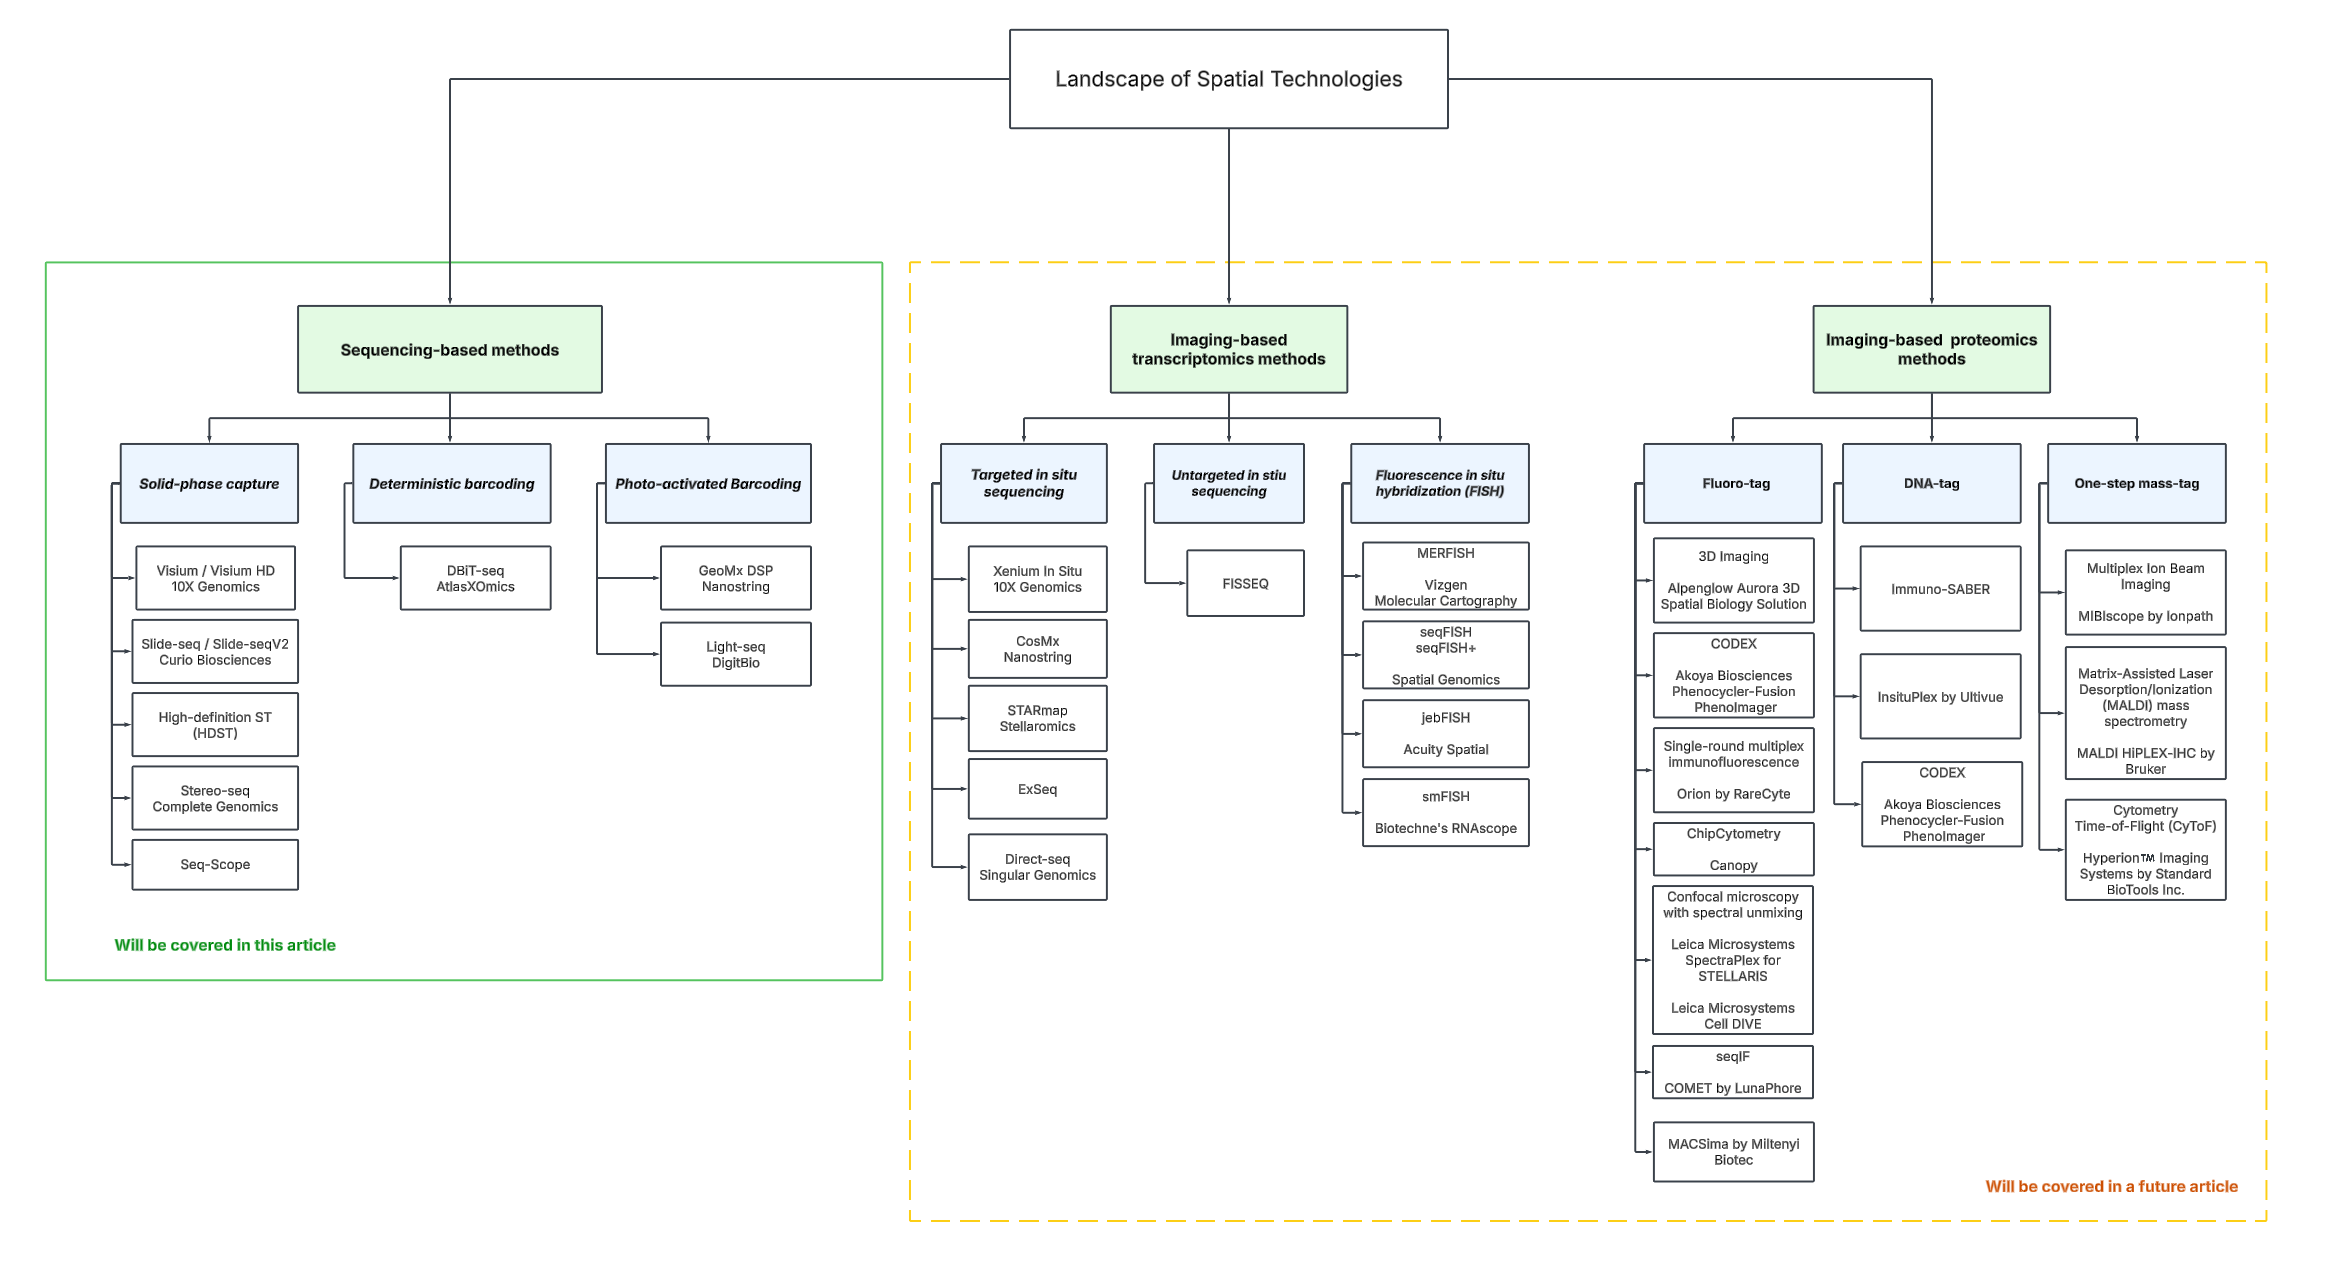
Sequencing-based methods involve strategies that ultimately use DNA sequencing to decode spatial information. There are several approaches:
Capturing molecules on barcoded surfaces (eg. ST/Visium)
Applying spatial barcodes directly to the tissue via microfluidics device (eg. DBiT-seq)
Using light to activate spatial barcoding in specific tissue regions (eg. Light-seq)

Imaging-based methods fall into two main categories:
In situ sequencing (ISS) involves hybridizing probes to target transcripts, amplifying the signal through techniques like rolling circle amplification, and then sequentially reading nucleotide sequences using iterative rounds of fluorescent labeling and imaging.
In situ hybridization (ISH), on the other hand, detects specific RNA or DNA sequences by hybridizing many fluorescently labeled probes directly to target molecules, enabling spatial localization.
To manage scope, this article focuses only on sequencing-based, transcriptomic technologies and even then gives a cursory overview of this material. Future branches of the tree will be addressed with dedicated pieces of writing.
Sequencing-based Methods
Core Concepts
Sequencing-based methods share four common steps:
Spatial indexing: hardware (e.g., microfluidic chips or spatially barcoded slides) assigns spatial coordinates to molecules within the tissue by delivering spatial probes.
Ligation of spatial barcodes: barcodes are transferred to molecules (e.g., RNA), linking the transcriptome to its original spatial position.
NGS sequencing readout: molecules are sequenced to generate transcriptomic data, but spatial context is retained through the barcodes.
Bioinformatics: A computational pipeline is often required downstream to reconstruct a matrix linking gene expression data back to specific tissue regions.
Classification by indexing technique
To further categorize these technologies, we can classify them by the technique used in the spatial indexing step:
Solid-phase capture – Tissue is placed on a barcoded slide (e.g., 10x Genomics Visium), which captures RNA at predefined spatial locations.
Examples:
ST/Visium (10x Genomics)
Slide-seq/Slide-seqV2 (Curio)
High-definition ST (HDST)
Stereo-seq (DNB-based) (Complete Genomics)
Seq-Scope

Deterministic barcoding (DBiT) – Uses microfluidic channels to deliver unique barcodes in a grid-like fashion, assigning precise spatial coordinates to molecules.
Examples:
DBiT-seq (AtlasXOmics)

Photo-activated barcoding – Uses light to selectively activate or release molecular barcodes, enabling spatially resolved profiling of biomolecules within defined regions.
Examples:
GeoMx DSP (Nanostring) (shown in diagram below)
Light-seq (DigitBio)

Methods by History
The development lineage of an assay reveals why certain things are the way they are and what ideas have already been tried.
Solid-phase capture spatial indexing by history
We'll start with the foundational solid-phase capture spatial indexing method introduced by Ståhl et al. in 2016. This technique laid the groundwork for future advancements, so it is useful to break down its core principles before moving on to more recent innovations

.
2016: The birth of solid-phase capture
The solid-phase capture spatial indexing method was introduced by Ståhl et al. in 2016. The key insight lay in using positionally encoded barcoded capture probes that allowed RNA transcripts to be mapped back to their original spatial locations within a tissue section. Early versions of Visium Spatial Gene Expression and Curio Biosciences Slide-seqV2 draw inspiration from Ståhl’s original paper.
To construct this system, a glass slide was coated with synthetically printed oligonucleotides, each assigned a unique spatial barcode. These barcodes were arranged in a known grid pattern, ensuring that every position on the slide corresponded to a specific barcode.

Each oligonucleotide on the barcoded slide contained five key regions:
A cleavage site to release captured molecules during processing,
An amplification and sequencing handle for downstream library preparation,
A spatial barcode encoding positional information,
A unique molecular identifier (UMI) to track individual transcripts and minimize PCR biases, and
An mRNA capture region with a poly(dT) tail to hybridize polyadenylated mRNA from the tissue.
When a tissue section was placed on top of the barcoded slide, cellular mRNA was released through enzymatic permeabilization and hybridized to the capture probes. Since the barcoded probes remained fixed on the slide, any captured mRNA automatically inherited a spatial identifier.
Once the mRNA was anchored to the barcoded probes, it was reverse transcribed into cDNA, incorporating the spatial barcode into each transcript. The synthesized cDNA molecules were then extracted and converted into sequencing libraries.
During NGS sequencing, two critical pieces of information were retained: the gene sequence, which identified the expressed transcript, and the spatial barcode, which mapped it back to its original location. By computationally aligning the sequenced transcripts with their corresponding spatial barcodes, researchers could reconstruct a high-resolution gene expression map of the tissue.
In the first development of spatial indexing, the author deposited ~200 million oligonucleotides in each of 1007 features, with a diameter of 100 mm and a center-to-center distance of 200 mm, over an area of 6.2 mm by 6.6 mm. They achieved a resolution of 100-200 µm.
In terms of detection efficiency, in comparison to single-molecule fluorescence in situ hybridization (smFISH), which detects nearly 100% of them, this method only captured about 6.9%. This is similar to scRNA-seq, which typically detects between 5% and 40% of molecules.
2019: Solid-phase spatial indexing commercialized by 10X Genomics’ Visium

The Visium platform by 10X Genomics commercialized solid-phase spatial indexing with single-cell transcriptomics sequencing in 2019. Compared to the original solid-phase spatial indexing technology, the Visium slide has a resolution that is 2-4X higher. The slide contains approximately 5,000 spots, each with a diameter of 55 μm.

A note on sequencing-based methods and Formalin-Fixed Paraffin-Embedded (FFPE) tissue
A recurrent limitation with spatial technologies is it only works with fresh-frozen tissues, excluding the FFPE-tissues that covers legacy and clinical data.

Since the 19th century, FFPE preservation remains the global standard for tissue preservation.
How it works: The process works through a precise sequence of chemical modifications. Tissues are first fixed in formaldehyde (formalin), which creates methylene bridges (-CH2-) between proteins. This crosslinking process primarily occurs between lysine residues and nearby nitrogen-containing groups, effectively creating a stable protein mesh that preserves cellular architecture and prevents tissue degradation. The fixed tissue then undergoes dehydration through a series of increasing ethanol concentrations, followed by a clearing agent (typically xylene) that removes the ethanol. Finally, molten paraffin wax infiltrates the tissue, replacing the clearing agent. Upon cooling, this creates a stable block that can be stored at room temperature indefinitely while maintaining cellular morphology.
However, this preservation comes at a molecular cost. The extensive protein crosslinking and nucleic acid modifications created during fixation present significant technical challenges for spatial transcriptomics and proteomics:
Chemical modifications of nucleic acids can interfere with hybridization efficiency
The cross-linked protein network can create steric hindrance for probe binding
RNA fragmentation occurs during the fixation process
Yet today, more than one billion FFPE samples sit in hospitals and biobanks worldwide (!) Unlocking access to FFPE samples will unlock a new market for these kit providers and help biologists unlock a level of insights into legacy biological samples that were unachievable before.
Maintaining its position as the first-mover in this market, in 2021, 10X Genomics launched FFPE support. The modified Visium protocol applies de-crosslinking at high temperatures and specific buffer conditions, which is essential to improve molecule capture from highly crosslinked FFPE samples before capturing mRNA molecules using standard oligo(dT) capture oligonucleotides.
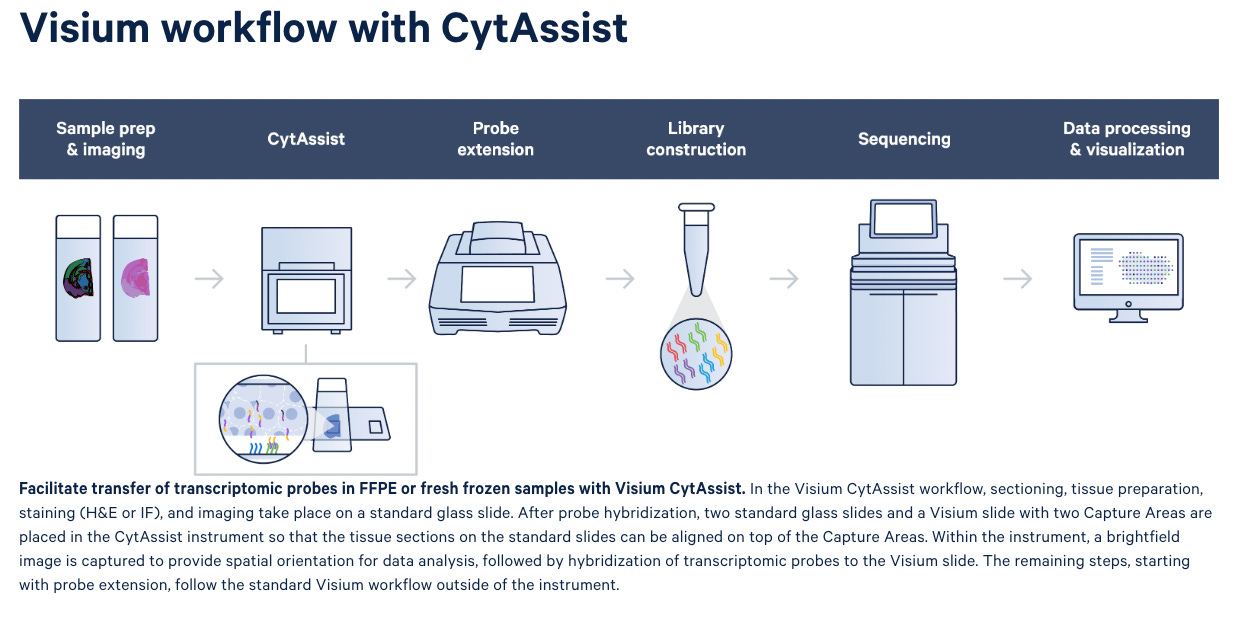
Easy Transfer of Samples from Standard to Visium Glass Slides with Visium CysAssist

In addition to the Visium assays, 10X Genomics also launched Visium CysAssist for Spatial Gene Expression and Protein in 2022. The instrument helps transfer transcriptomic probes from standard glass slides to Visium glass slides (see step 2) in the diagram below). This gives scientists the flexibility to perform staining (H&E or IF) and imaging on standard glass slides upstream of the Visium workflow.
2019: Slide-seq further decreased resolution to 10-μm
Slide-seq (Rodriques et al.), introduced in 2019, was designed to improve the resolution of the original Visium assay. Instead of using a glass slide with barcoded spots like Visium, Slide-seq arranges tiny 10-μm beads—each with a unique DNA barcode—into a thin, flat layer on a rubber-coated glass coverslip. These beads are similar to those used in single-cell RNA sequencing (Drop-seq). When a fresh frozen tissue sample is placed on top, RNA from the tissue binds to the barcoded beads, allowing researchers to map gene expression at a finer scale. The unique barcode on each bead is identified using a sequencing method called SOLiD (sequencing by oligonucleotide ligation and detection).
In 2020, Slide-seq V2 was introduced with improvements in how the beads are made, how the sequencing libraries are prepared, and how the bead arrays are indexed. These changes significantly increased RNA capture efficiency—about 10 times higher than the original Slide-seq and reaching ~50% of the efficiency of single-cell RNA sequencing.
2023: Curio Biosciences commercialized Slide-seq V2 with Curio Seeker.
In 2023, Curio Biosciences (recently acquired by Takara) launched Curio Seeker to commercialize Slide-seq V2.

Once a tissue section is placed on the Curio Seeker tile, mRNA is captured and hybridized on the spatially-indexed beads before reverse transcription. The indexed beads are then dissociated from the tile and the tissue digested, followed by second strand synthesis and cDNA amplification. Purified cDNA undergoes NGS library preparation and sequencing. The resulting FASTQ files are processed by the Curio Seeker bioinformatics pipeline to create a continuous whole transcriptome spatial map of the tissue section.
With Curio Seeker, since the size of each DNA-barcoded bead is 10 μm and each mammalian cell is approximately 10 μm, scientists can achieve near-single cell resolution with CurioSeeker, where each bead can contain 1-2 cells.
Curio Seeker offers a simple, single-day workflow without any specialized instrumentation. One downside, however, is Curio Seeker does not yet support FFPE tissues (as of February 2025).
2024: True single-cell resolution with Curio Trekker
Curio Seeker offers a 10 μm resolution, but each bead captures RNA from 1-2 cells, which means computational cell deconvolution is required in downstream analyses to assign transcript profiles to each single cell. In contrast, Curio Trekker enables true single-cell spatial mapping by directly diffusing spatial barcodes to individual cell nuclei, eliminating the need for post-processing to resolve cellular identities.

The workflow begins by melting a frozen tissue section onto its spatially barcoded surface. Upon UV activation, oligonucleotides carrying spatial barcodes are cleaved from the beads and bind to nearby nuclei, preserving their spatial context. These spatially tagged nuclei are then processed through standard single-nucleus RNA sequencing (snRNA-seq) workflows, where both spatial barcode oligos and cellular RNA are captured and amplified. A custom bioinformatics pipeline reconstructs the spatial position of each nucleus by decoding its barcode profile, enabling high-resolution spatial transcriptomic mapping.
The Curio Trekker workflow takes 1 hour to complete upstream of standard snRNA-seq workflow. There is no need for any specialized instrumentation beyond a single-cell sequencing platform and NGS sequencer.
In comparison to Curio Seeker, where each spot contains 1-2 cells, Curio Trekker provides single-nuclei spatial mapping without the need for deconvolution in downstream analyses. On the other hand, it is worthwhile to note that the mRNAs profile of a single nuclei may not always recapitulate the mRNAs profile of a single cell in certain cell types. For example, neurons are highly polarized cells with extensive cytoplasmic projections (axons, dendrites). Plasma cells have high cytoplasmic mRNA content for antibody production, which is largely absent in single-nucleus RNA-seq.
2024: Even lower resolution with Visium HD
In 2024, 10X Genomics introduced Visium HD, a next-generation spatial transcriptomics assay with significantly enhanced resolution. Each Visium HD slide features two 6.5 × 6.5 mm capture areas within an 8 × 8 mm fiducial frame, densely packed with ~11 million uniquely barcoded 2 × 2 µm squares.

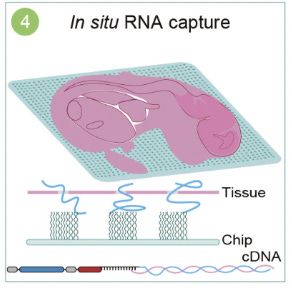
Researchers can start the Visium HD workflow from fresh frozen, fixed frozen, or FFPE tissue blocks and freshly section onto glass slides, or from pre-sectioned tissue slides. This FFPE compatibility provides access to archived samples. After the H&E or IF staining steps, tissues are treated with whole transcriptome probe panels, enabling hybridization and ligation of probe pairs to their targets. The simple, CytAssist-enabled workflow then facilitates transfer of the gene expression probes from the tissue sections onto Visium HD slides (Figure 1).

The architecture of the Visium HD slide Capture Area is a key factor in the high-resolution spatial insights the assay provides (Figure 2). The Capture Areas contain a continuous lawn of oligonucleotides arrayed into millions of 2 x 2 µm barcoded squares that capture the gene expression probes. Spatial Barcodes in the oligonucleotides enable spatial mapping of gene expression readouts back to tissue section images.
The final steps involve sequencing and data analysis to map gene expression across the tissue section at high resolution. Different from Visium (50 µm square) and Curio Seeker (10 µm spot), which encompasses more than one cell, each Visium HD’s 2 µm-square is smaller than most single cells.

The new 2 µm resolution enabled by Visium HD unlocks advanced biological insights by offering a granular view of not only cellular but also subcellular structures.
To put this into perspective, small immune cells such as lymphocytes typically measure around 5-7 µm. At this enhanced resolution, researchers can visualize intricate features like immune synapse formation between T cells and antigen-presenting cells, revealing precisely how immune cells interact with their targets.
Another example is the visualization of hypoxia gradients within solid tumors. As tumors grow, their rapid cell proliferation often outpaces the development of new blood vessels, leading to regions of low oxygen (hypoxia) typically at the tumor's core. This hypoxia gradient influences tumor biology by inducing gene expression changes through pathways such as HIF-1α (Hypoxia-Inducible Factor 1-alpha), which promotes survival mechanisms, angiogenesis, and metabolic adaptations.

At 2 µm resolution, researchers can precisely map how gene expression patterns shift from the well-oxygenated tumor periphery to the hypoxic core. This fine-scale resolution allows for the identification of specific cell types or cellular states that thrive under low oxygen conditions and those that are more susceptible to hypoxia-induced cell death. Additionally, it enables the study of how immune cell infiltration changes along this gradient, providing insights into how hypoxia might contribute to immune evasion within the tumor microenvironment.
2019: High-definition spatial transcriptomics (HDST) (Currently an academic method, no commercialization yet)

Operating at a similar 2-μm in Visium HD is an academic method known as high-definition spatial transcriptomics (HDST), developed by Vickovic et al.
The key innovation in HDST lies in fabricating a high-resolution, high-density bead array. The researchers used a "split-and-pool" approach to generate 2,839,865 individual barcoded beads, each 2 μm in size.

To construct the array, the researchers created 1,467,270 hexagonal wells etched into a 13.7 mm² planar silica slide, ensuring single-bead occupancy through controlled acid etching and polishing to 1 μm height. A bead pool was loaded onto these slides, with 2.05 μm well diameters ensuring >99% single-bead coverage. This intricate array generation strategy enabled the creation of a uniquely identifiable bead library, setting the foundation for ultra-high-resolution spatial transcriptomics.
Next, the positional barcodes are identified by sequential hybridization rounds, imaging and error correction. Integration with corresponding H&E staining allows for subcellular compartmentalization and the extraction of nuclear expression features.
Since HDST fixes single beads in specific wells, it reduces issues of RNA diffusion and cross-contamination, which can be a problem in solid-phase capture methods where multiple transcripts may spread across neighboring barcodes. The technique also enables the capture of RNA directly from histological tissue sections, allowing seamless integration with H&E staining or immunohistochemistry (IHC).
One downside is there’s no commercial solution available for this method, lowering ease of use.
2022: Emerging technology, Stereo-seq, with sub-micron resolution
Exceeding previous technologies, Complete Genomics’ STOmics platform pioneered Stereo-seq (Spatial Enhanced Resolution Omics-sequencing) which achieves sub-micron resolution with each spot measuring 220 nm in diameter, a 10X increase in resolution in comparison to Visium HD.

Stereo-seq represents a significant advancement in spatial transcriptomics, combining unprecedented resolution with large-scale coverage. The technology builds upon DNA nanoball (DNB) sequencing to achieve high-definition spatial transcriptomics.
The platform is built upon a DNB-patterned array, which consists of lithographically etched chips with ultra-small spots measuring 220 nm in diameter. These spots are precisely arranged with center-to-center distances of 500-715 nm, enabling an exceptionally high-density layout of up to 400 spots per 100 μm² of tissue. This structured array forms the foundation for high-resolution spatial capture.

Spatial encoding is achieved by placing DNA nanoball (DNB) templates with random barcodes onto a patterned array. Each spot is assigned a unique coordinate identity (CID). The combination of CIDs and random barcodes creates a vast library of 4²⁵ unique spots, enabling highly precise spatial mapping across the platform.

For molecular capture setup, Unique Molecular Identifiers (UMIs) and polyT sequences are introduced at each spot. These elements are ligated through hybridization with CID-containing oligonucleotides, effectively establishing the molecular machinery required for RNA capture.

The tissue processing stage involves placing frozen tissue sections, typically 10 μm thick, onto the chip. The tissues then undergo fixation and permeabilization, allowing polyA-tailed RNA from the tissue to be captured. Following this step, the captured RNA is subjected to reverse transcription and amplification.
Finally, during library preparation and sequencing, the amplified, barcoded cDNA is collected and prepared for sequencing. This step enables both RNA sequences and their corresponding spatial barcodes (CIDs) to be sequenced, ensuring accurate spatial transcriptomic profiling.

Stereo-seq is commercialized by Complete Genomics as its STOmics platform, currently in early access.

One of Steoreo-seq’s strength is its nanoscale resolution: The technology achieves the lowest resolution in the market at the size of 220-nanometer per spots

Stereo-Seq accommodates larger tissue samples by offering a centimeter-level field of view. To putThe standard frame is 1 cm x 1 cm and can be expanded to 13 cm x 13 cm for interrogating whole mammalian embryos, human organs, or model organisms.

Stereo-seq also checks the box for supporting fresh/fixed, frozen, and FFPE tissue samples.
The poly-adenylated mRNA capture method is species-agnostic and supports a wide range of tissues and species, including humans, animals, and plants.
Finally, Complete Genomics’ STOmics recently launched Stereo-CITE-Solution, which enables capture of the whole transcriptome and 100+ proteins on the same tissue section.
On the other hand, Stereo-seq requires highly specialized equipment, including patterned DNB chips and custom sequencing instruments from BGI-Complete Genomics. End-user scientists will have to purchase their T4 or G400 sequencing instruments, which may make it more unaffordable for labs on constrained budgets.
Stereo-seq Isn’t Alone: The Rise of Sub-Micron Spatial Transcriptomics
The race toward higher spatial resolution is reminiscent of Moore’s Law for transistor scaling. In recent years, technologies like Seq-Scope, pushing spatial transcriptomics into the sub-micron range and expanding the competitive landscape beyond Stereo-seq.
October 2024: seqScope repurposes Illumina’s flow cells (Academic method, not commercialized yet)
The core insight from seqScope is repurposing existing Illumina machines’ flow cells into high-resolution spatially barcoded arrays.
How standard Illumina flow cells work:
Standard Illumina flow cells have a patterned surface with immobilized primers designed to capture DNA fragments. Normally, a DNA library is loaded onto the flow cell during sequencing, and DNA fragments hybridize to these primers.

The hybridized DNA molecules are amplified through bridge amplification, a process in which they bend over and bind to adjacent primers, forming clusters. Each cluster originates from a single DNA molecule and contains many copies of that sequence.

Tagged nucleotides are added in order to the DNA strand. Each of the four nucleotides have an identifying label that can be excited to emit a characteristic wavelength. A computer records all of the emissions, and from this data, base calls are made.
Seq-Scope hijacks this standard Illumina sequencing workflow to create a spatially barcoded array instead of sequencing genomic DNA. Instead of sequencing genomic DNA, Seq-Scope first loads a custom oligonucleotide library onto the flow cell. These oligonucleotides contain:
A unique spatial barcode (HDMI) that encodes the exact location of each cluster.
A poly(T) tail to capture mRNA later.
Sequencing adapter sequences for later amplification.

1st-Seq: The flow cell undergoes a sequencing run, where the HDMI sequences are read and recorded. This step does not sequence any biological sample—instead, it generates a spatial map of the barcode locations on the flow cell. Each barcode is associated with a specific X-Y coordinate on the flow cell.
After 1st-Seq, the flow cell is disassembled to expose the surface where these spatially mapped DNA clusters reside. See the pictures of what the flow cells look like after they are physically extracted and diced.

mRNA Capture Using HDMI Barcodes: A tissue section is placed directly onto the exposed flow cell. During permeabilization, mRNA is released from the tissue and binds to the poly(T) sequences on the clustered oligos. This step tags each mRNA transcript with the spatial barcode of the DNA cluster it hybridized to, preserving its spatial context.

2nd-Seq – Reverse Transcription and Library Preparation: The captured mRNA is reverse-transcribed into cDNA, incorporating the HDMI barcode from the flow cell into the cDNA sequence. This cDNA is then amplified and sequenced in a second Illumina run (2nd-Seq), generating gene expression data along with their corresponding spatial barcodes.

The sequencing data from 2nd-Seq contains: gene expression data (from the tissue) and spatial barcodes (from the HDMI sequences). By mapping each read to its HDMI sequence, a spatial gene expression map is reconstructed.
This clever repurposing of Illumina technology allows Seq-Scope to achieve subcellular spatial transcriptomics with the existing sequencing infrastructure.
Advantages of Seq-Scope is it can achieve ultra-high, subcellular resolution (~0.5–2 µm) due to the dense patterned DNA clusters on Illumina flow cells. This is 1-4X higher than Visium HD and 10-20X higher than Curio Seeker’s Slide-seq. Unlike Visium or Slide-seq, which require specialized barcoded slides or beads, Seq-Scope encodes spatial information directly through Illumina’s pre-patterned clusters. This eliminates the need for specialized slides, simplifying adoption. However, it does require specialized handling of flow cells, which can decrease reproducibility between scientists to scientists.
One downside of Seq-Scope is limited tissue compatibility – Seq-Scope only works with fresh-frozen tissues, making it incompatible with FFPE samples, which limits its use in clinical and archival tissue studies. Unlike Visium Spatial Gene Expression or Stereo-seq OMNI, which allows protein co-detection, Seq-Scope is restricted to RNA sequencing. Finally, while cost-effective, Seq-Scope requires highly manual handling of flow cells, making it less user-friendly compared to fully automated spatial platforms. However, for labs prioritizing budget over convenience, it remains a viable option.
Deterministic Spatial Barcoding by History
We now move onto the second branch of sequencing-based methods, where the spatial indexing method is based on deterministic barcoding.

2020: Multi-Omics Sequencing via Deterministic Barcoding
In 2020, Liu et al. from the Rong Fan lab published DBiT-seq - Deterministic Barcoding in Tissue for spatial omics sequencing. Notably, they showed the technology worked for co-mapping of mRNAs and proteins in a formaldehyde-fixed tissue slide via NGS sequencing.

Unlike solid-phase spatial transcriptomics, where tissue is placed directly on a barcoded slide, DBiT-seq delivers spatial barcodes directly to the tissue using microfluidic channels. This method enables high-resolution (10–50 µm) gene and protein expression mapping within tissue sections.
The process begins with tissue preparation, where a formaldehyde-fixed tissue section is placed on a slide to preserve RNA integrity. Antibody-derived DNA tags (ADTs) bind to target proteins, tagging them for spatial proteomics.

Next, spatial barcoding is applied in two sequential steps: first along the X-axis using a microfluidic chip with 50 parallel channels, each delivering a unique barcode, and then along the Y-axis with a perpendicular chip introducing a second set of barcodes. These barcodes ligate at intersections, creating a spatially unique identifier for each grid location.

After barcoding, the tissue is imaged to correlate molecular data with histological features. Barcoded cDNA is extracted, amplified, and prepared for sequencing. Paired-end sequencing reads identify gene expression, spatial barcodes define locations, and unique molecular identifiers (UMIs) quantify transcripts.
Computational analysis reconstructs high-resolution spatial omics maps, allowing researchers to overlay molecular expression data onto tissue morphology for deeper insights.

Advantages of DBiT-seq is that it’s multi-omic, capturing both transcriptomic (mRNA) and proteomic (protein via antibody-derived tags) information in the same tissue section. The technique also preserves tissue integrity, as it does not require the lysis of tissues to release mRNAs and is compatible with existing formalin-fixed paraffin-embedded (FFPE) and fresh-frozen tissue samples. It is easy to use, no specialized equipment beyond the microfluidic barcoding kit.

One trade-off of the technology is its theoretical limit on pixel size and resolution. While diffusion experiments suggest that spatial barcoding can theoretically achieve a resolution as fine as ~2 µm, practical limitations arise due to tissue thickness (>5 µm) and deformation during microfluidic barcoding. If the microchannels are too small or shallow, they may become obstructed by tissue distortion, preventing efficient reagent flow. In practice, the smallest reliably achievable pixel size is around 5 µm, meaning that most pixels encompass either one whole cell or a fraction of a cell.
2022: AtlasXOmics commercialized DBiT-seq.
DBiT-seq is commercialized by AtlasXOmics in 2022 with the Gen 1 DBiT-seq chip. Its latest kit, FlowGel, is an easy-to-use platform for spatial epigenome analysis at single cell level.

DBiT-seq’s modular design extends beyond RNA and protein profiling, enabling spatial epigenomics assays such as chromatin accessibility and histone modification mapping. By adding biochemical steps before the microfluidic barcoding process, researchers can use DBiT-seq to study spatially resolved epigenetic landscapes.
AtlasXomics has demonstrated this flexibility by adapting DBiT-seq for spatial CUT&Tag and spatial ATAC-seq, allowing high-throughput chromatin state profiling with minimal modifications to the workflow.
Spatial CUT&Tag maps histone modifications and transcription factor binding, identifying active and repressed chromatin regions within tissues. This is achieved by using antibodies to target specific histone marks, followed by Tn5 transposase tagging, which inserts sequencing adapters at regulatory sites while maintaining spatial tissue structure.

Spatial ATAC-seq, on the other hand, maps open chromatin regions without requiring antibodies. Instead, Tn5 transposase directly tags nucleosome-free regions, marking promoters and enhancers for sequencing. After this step, standard DBiT-seq barcoding is applied to retain spatial resolution. These adaptations highlight DBiT-seq’s versatility, making it a powerful tool for spatially resolved multi-omic analysis.

While DBiT-seq offers lower resolution than Visium HD, HDST, Stereo-seq, and Seq-scope, it stands out as the only current technology capable of profiling the epigenome in spatial contexts. Its modular spatial barcoding kit, combined with the multi-omic potential demonstrated in Rong Fan’s original paper, positions AtlasXOmics as a promising platform for expanding into additional multi-omics modalities.
Photo-activated Spatial Barcoding by History
We previously covered solid-phase capture and microfluidic-based deterministic barcoding methods. Now, we turn to photo-activated spatial barcoding, which uses light to precisely activate barcoding in selected regions of interest.

This approach enables high-resolution spatial transcriptomics by controlling where and when molecular barcodes are applied.

GeoMx: From microscope to transcriptomics and back
A well-known option for target region of interest (ROI)-based sequencing is GeoMx, which can profile the whole transcriptome and 600+ proteins simultaneously.

The workflow starts with a single slide being manually or automatically stained with fluorescent reagents to targeted areas of the tissue, which allows the GeoMx DSP instruments to capture images with morphological context.
Scientists can then use an intuitive software interface to select ROIs by tissue morphology, by phenotype, by individual cells, by gridding, or by contouring the area.

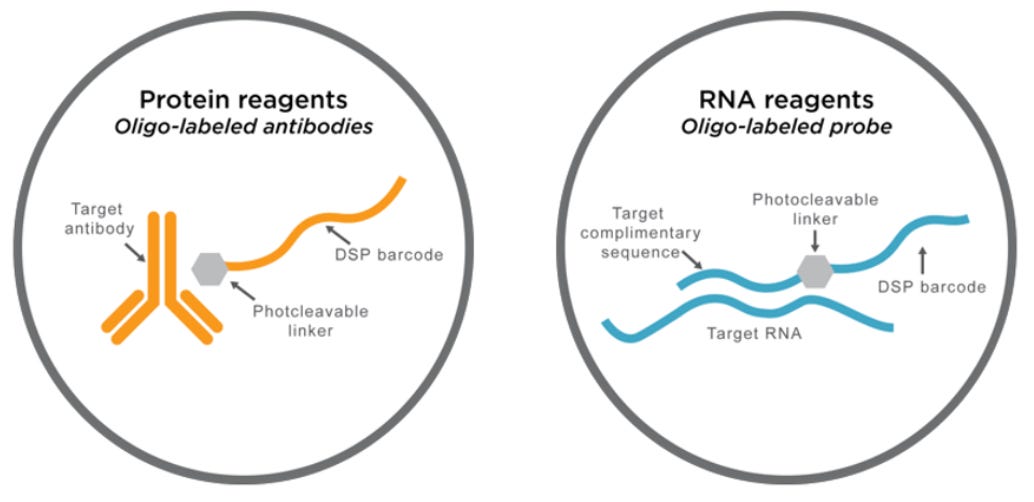
The key to the GeoMx GSP technology lies in the photocleavable oligonucleotide tags that are attached to antibodies or RNAs via a light-sensitive linker. UV light is used to decouple the high-plex oligo tags from the antibodies or RNA in the selected area of interest.
Oligos are then retrieved from the surface of the tissue, without disturbing the tissue, allowing the samples to be reused. The oligos are then deposited into a microtiter plate where they can later be put in an analyzer (nCounter machine or Illumina NGS) for quantitative analysis. These steps are repeated for every ROI.
Released tags are quantitated in a standard nCounter assay or an NGS machine, and counts are mapped back to tissue location, yielding a spatially-resolved digital profile of analyte abundance.
One advantage of GeoMx is it is non-destructive to tissue samples: Tissue morphology is preserved, enabling multiple rounds of analysis on the same sample. It is multi-omic and able to simultaneously detects RNA and proteins using oligonucleotide-tagged antibodies. Thanks to its flexible ROI selection, it allows researchers to define regions of interest in any shape or size, down to ~10 µm (1-2 cells), making it adaptable for diverse tissue architectures. The technology also reports high reproducibility, with multiple rounds of analysis showing strong correlation (R² = 0.9569) between repeated measurements, ensuring reliable spatial expression data.

A downside is GeoMx is not true single-cell transcriptomics profiling – While ROIs can be as small as 10 µm, the method requires 20–300 cells per ROI for reliable quantification, limiting its utility for single-cell analysis. Profiling at a true single-cell level would require drawing tens of thousands of 10 µm ROIs, making it impractical for large-scale analysis.
Light-seq (October 2022)
Like GeoMx, Light-seq is another innovation that combines the power of microscopy and imaging with high-throughput sequencing to examine the spatial transcriptome. The core innovation of Light-seq lies in its ability to attach sequenceable spatial indices onto biomolecules in intact samples using light.

For whole-transcriptome sequencing, the tissue is first fixed and permeabilized to expose its RNA content. Reverse transcription (RT) is then performed in situ, converting RNA into complementary DNA (cDNA).
Next, 3-cyanovinylcarbazole nucleoside (CNVK) – an ultrafast photocrosslinker – is introduced. When UV light is shone to a region of interest, the CNVK-containing strands are hybridized with complementary docking sequences on the RNAs. The noncrosslinked barcode strands can be washed away. The process can be iteratively performed to label multiple ROIs with orthogonal barcode strands.

To precisely direct light to an ROI, the authors used a digital micromirror device (DMD) attached to a standard widefield imaging setup. Using a ×10 objective, a single mirror in our DMD setup can yield a practical resolution <2 µm. As an alternative for DMD, a laser scanning system can also be used for serial barcoding, making Light-Seq very accessible without the need for extra equipment.

Next, to read out the sequence of target DNAs with their corresponding crosslinked spatial barcode, Light-seq used a cross-junction synthesis reaction to copy both the barcoded DNA sequence and barcode into a new single strand of DNA without a crosslink. This process results in a single-stranded DNA product that contains both the target DNA sequence and the spatial barcode.

Light-Seq enables the profiling of rare retinal cell populations, overcoming the limitations of traditional single-cell RNA sequencing (scRNA-seq), which often fails to capture these cells due to their scarcity and dissociation-induced loss of spatial context. One key success is its ability to profile Dopaminergic Amacrine Cells (DACs), which make up ≤0.01% of retinal cells and play essential roles in light adaptation and circadian rhythms.

The workflow begins with in situ reverse transcription (RT) on fixed retinal sections, preserving spatial context while converting mRNA into complementary DNA (cDNA). DACs are then identified using immunofluorescence (IF) staining with tyrosine hydroxylase (TH) as a marker, followed by targeted barcoding. TH− DACs are labeled with FITC-labeled strands (~500 cells per section), while TH+ DACs are tagged with Cy3-labeled strands (4–8 cells per section). Finally, barcoded cDNAs are displaced for sequencing, leaving the sample intact for further analysis.

This approach confirmed established DAC markers (Th, Cartpt, Slc18a2) and identified new candidate genes (Arpp21, Vgff63, Gpx3) with potential roles in dopaminergic function and neurological diseases. Unexpectedly, Stra6, a vitamin A transporter previously linked to the retinal pigment epithelium, was found in TH+ DACs, suggesting a new role in retinal pathology. These findings highlight Light-Seq’s ability to uncover novel gene functions while preserving the spatial organization of rare cell types.
The creators of Light-Seq have since founded Digit.bio, though the company's website provides limited details on how extensively the technology is being used or for what specific applications. For the most up-to-date insights, we recommend reaching out to the company directly.
Light-seq offers many advantages. The technology utilizes photocrosslinking with UV light to spatially barcode biomolecules without disrupting tissue integrity, allowing precise targeting of specific regions of interest (ROIs) while preserving morphology. The nondestructive nature of Light-Seq also enables subsequent multi-omic measurements from the same cells.
The technology supports profiling from regions as small as 4 cells to over 1,000 cells, offering higher sensitivity compared to Nanostring’s DSP-based platforms, which require 20–300 cells per region. Unlike surface capture or microfluidic-based methods, Light-Seq selectively amplifies only barcoded cDNAs for sequencing, significantly reducing sequencing costs and allowing flexible depth optimization. This efficiency is particularly beneficial for rare cell studies, as demonstrated by the DAC study, where a single pooled MiSeq run (20 million reads) covered all replicates. Additionally, Light-Seq can be implemented with standard widefield microscopy and a digital micromirror device (DMD) for illumination, or alternatively, a laser scanning system, offering broader accessibility than platforms dependent on expensive DSP instruments.
Though Light-Seq supports iterative barcoding, the number of uniquely addressable barcodes per round is constrained by factors such as the spectral overlap of fluorescent labels. Each barcode set is tagged with distinct fluorophores (e.g., FITC, Cy3), but the finite availability of non-overlapping fluorophores limits the number of barcodes that can be simultaneously distinguished in a single round. Additionally, overlapping emission spectra can lead to signal bleed-through, compromising barcode specificity and reducing the accuracy of spatial transcriptomic measurements.
Methods by Properties
An overview of capture area, resolution, tissue types and analyte information across methods can be very useful for designing experiments and selecting tools.
To help readers select appropriate technology for their spatial experiments, we provide a summary table.
Resolution
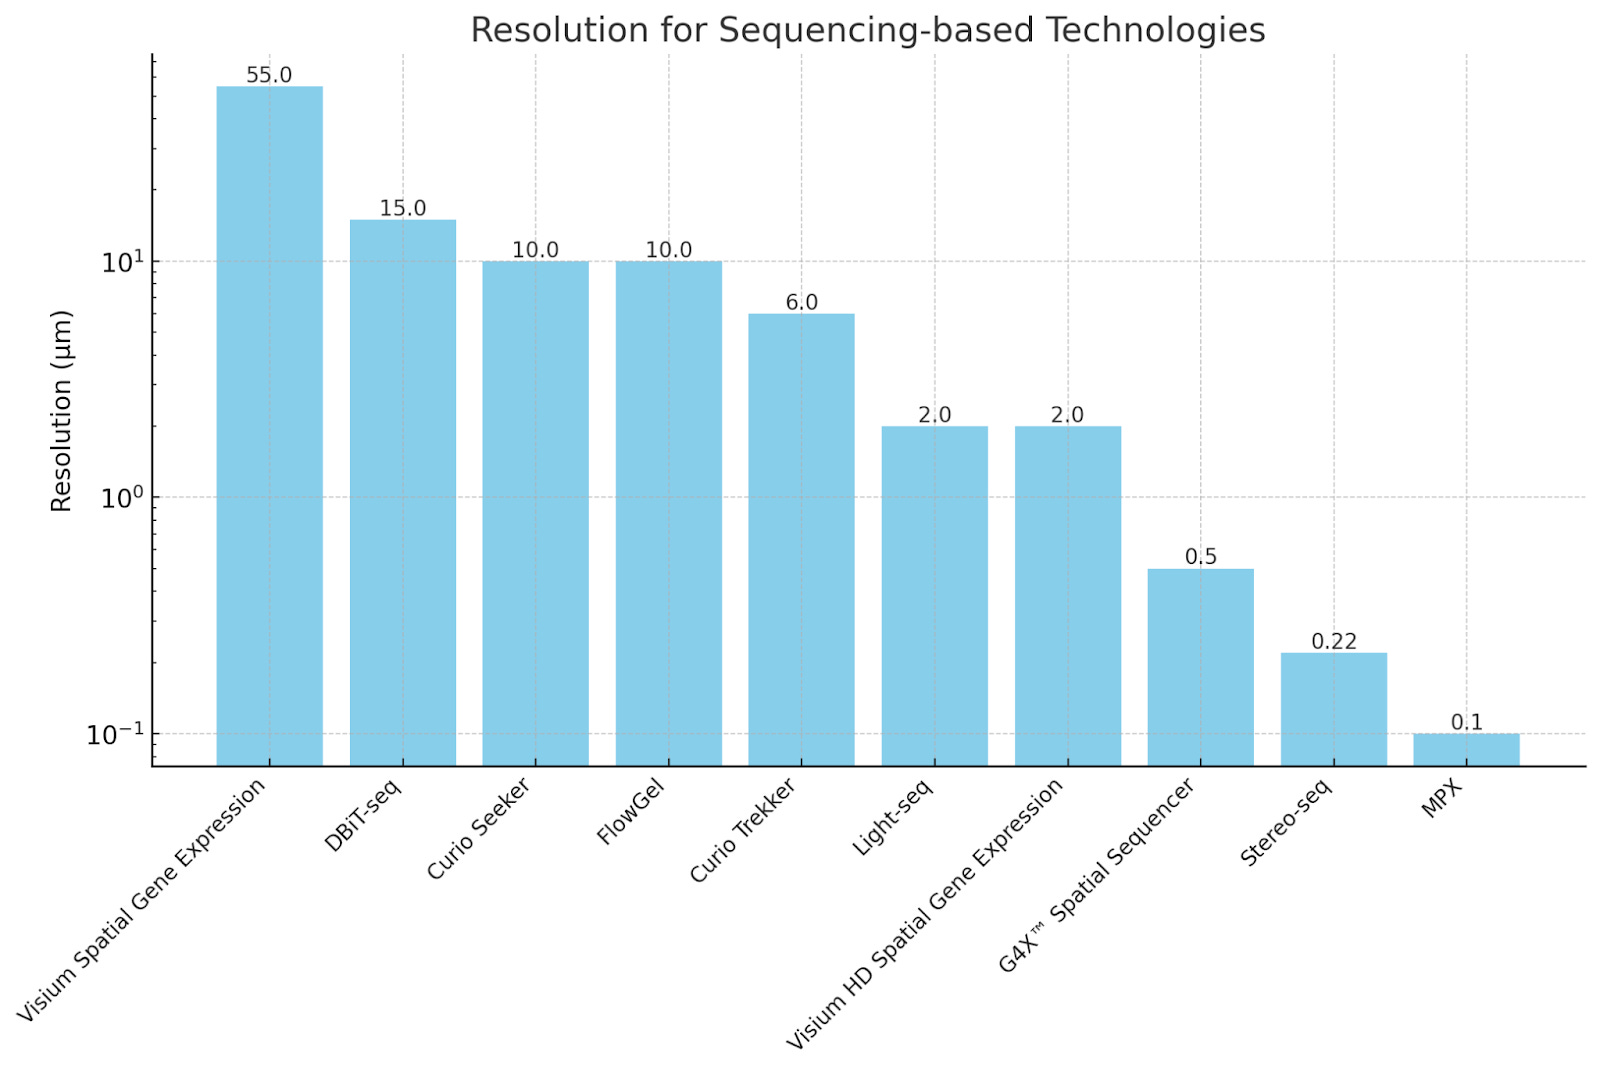
Given that cellular processes often occur at subcellular scales, it is unsurprising that spatial sequencing technologies have evolved toward higher resolution to capture finer biological details. In just five years, solid-state spatial transcriptomics has improved from ~50 µm resolution (Visium, 2019) to 0.22 µm (Stereo-seq, 2024)—a 450X resolution increase! Even at 10 µm resolution, as in case of Curio Seeker or AtlasXOmics’ DBiT-seq, represents a 10X improvement over early technologies and enables near single-cell resolution.
Lower resolution is not necessarily always better, but rather depends on the biological questions at hand.
At 50 µm resolution, bulk transcriptomic trends across tissue regions (e.g., tumor vs. stroma) is sufficient.
At 10 µm, spatial heterogeneity between individual cells in complex tissues (e.g., immune infiltration in tumors) becomes accessible.
Subcellular resolution (~0.22 µm) is critical for processes like RNA localization, immune synapse formation, and chromatin organization, where molecular distributions within a single cell dictate function.
If the goal is to analyze specific regions of interest (ROIs) rather than every cell, techniques like GeoMx DSP (which allows selection of regions from 10 µm to 600 µm) may be more efficient than whole-slide single-cell profiling.
Pixelgen’s Molecular Pixelation (MPX) technology differs from other spatial transcriptomics methods by focusing on immune cell phenotyping at the subcellular level. Unlike sequencing-based spatial methods that primarily analyze RNA localization, MPX specifically maps how protein surface markers are distributed and localized on the immune cell membrane. This focus is better suited for researchers who want to study cell polarity, receptor clustering, and dynamic immune signaling.
Capture Area per Run

Stereo-seq (STOmics by Complete Genomics) stands out with the largest capture area per run at 13 cm x 13 cm (17,424 mm²), making it the only technology with both decimeter-scale coverage and nanometer resolution. This enables researchers to profile whole mammalian embryos, human organs, or model organisms, while still allowing region-specific zoom-ins after data processing. Other high-capture-area technologies include Singular Genomics’ G4X Spatial Sequencer (4,000 mm²) and Nanostring’s GeoMx DSP (304 mm²).
However, higher capture area and finer resolution come at a trade-off of cost—Stereo-seq, G4X, and GeoMx DSP all require specialized instruments. In contrast, kit-based approaches like Visium Spatial Gene Expression, Curio Seeker, Curio Trekker, FlowGel, and DBiT-seq provide user-friendly kits, where transcripts are tagged with spatial barcodes, preserving their location within the tissue. Once barcoded, these transcripts can be processed using any compatible NGS machine, which are commonly available in labs and university computational cores.
Tissue Type
A large number of legacy biological samples are stored in FFPE (formalin-fixed, paraffin-Eembedded) format, a method that preserves tissue morphology and biomolecules for long-term storage. While FFPE is widely used in clinical and archival samples, it can degrade RNA, making it challenging for some spatial transcriptomics technologies. In contrast, fresh frozen tissue preserves RNA integrity better, enabling higher-resolution spatial sequencing. Some technologies support both formats, while others specialize in either FFPE or fresh frozen:
Only fresh frozen: Curio Seeker, Curio Trekker, Stereo-seq Transcriptomics, Stereo-CITE Proteo-Transcriptomics
Only FFPE: DBiT-seq, FlowGel, G4X Spatial Sequencer, Stereo-seq OMNI, Visium Spatial Gene Expression with protein co-detection.
Supports both fresh frozen and FFPE: Visium Spatial Gene Expression, Visium HD Spatial Gene Expression, GeoMx DSP
Cannot be run on tissue, only cell cultures extracted from tissues: MPX (Molecular Pixelation)
Analyte
The majority of providers capture spatial information for the whole transcriptome. AtlasXOmics stands out as the only provider for spatial epigenome, namely with its spatial ATAC-seq and CUTnTAG product. Given the modular nature of the DBiT-seq kit, AtlasXOmics is well on its way to expand its portfolio to other -omics modalities. GeoMx DSP is whole transcriptome but does not necessarily provide first-class support for single-cell transcriptomics for all cells. Users are required to lasso-select ROIs of the size of individual cells of interest, which makes it more applicable for targeted selection of cells versus unbiased profiling of all cells.
If you are looking at solutions with both whole transcriptome and protein co-detection, there are two main options. Stereo-CITE Proteo-Transcriptomics can profile up to 100+ proteins and whole transcriptome simultaneously for fresh frozen human and mouse samples. Nanostring also offers co-detection of up to 570+ proteins.
Several platforms also allow multiplexed immunofluorescence (mIF), where antibody-based staining is performed in a sequential workflow to visualize protein expression. For instance, 10X Genomics’ Visium Spatial Gene Expression (FFPE) supports immunofluorescence staining, but does not currently provide a highly multiplexed protein detection assay like CITE-seq or GeoMx, although it is on the company’s roadmap.
Species
For model organisms outside human and mouse, 10X Genomics’ Visium Spatial Gene Expression has been shown to work with non-human primates, marines, plants, and insects. Curio Seeker, Curio Trekker, and Complete Genomics STOmics’ Stereo-seq Transcriptomics platforms are all species-agnostic.
Future developments
We can expect to see progress in a few key areas in the future.
The push towards sub-micron resolution and higher detection efficiency
Sequencing-based spatial profiling technologies are powerful tools and are improving rapidly: moving from 100 microns in the original 2019 solid-phase capture paper to 0.22 microns in the latest Complete Genomics STOmics Stereo-seq technology.
While these approaches offer unbiased whole-transcriptome profiling, they often face trade-offs in detection efficiency and sensitivity.
Conversely, imaging-based methods, such as MERFISH, deliver exceptional gene detection efficiency and have steadily increased their gene profiling capacity, reaching up to 6,000 genes with NanoString's CosMx solution. Looking ahead, the key hurdles for the field include improving spatial resolution in sequencing-based technologies without sacrificing gene detection capacity and sensitivity that is often found in imaging-based methods.
New momentum with 3D sequencing
Traditional spatial profiling techniques typically analyze 5-10 micron thick tissue sections, but emerging 3D solutions are pushing the boundaries of what's possible. For instance, Stellaromics’ newly launched Pyxa platform can profile over 1,000 genes in a fully intact mouse brain, as demonstrated in a recent preprint. Similarly, Alpenglow Biosciences' 3D platform enables high-resolution immunofluorescence imaging in three dimensions, offering new possibilities for capturing complex tissue architectures and spatial interactions.
Expanding multi-omics on the same sample
Expanding number of -omic modalities supported is another exciting avenue for development. Every sample is precious; how can commercial solutions enable scientists to maximize the value gained from their sample?
For sequencing-based methods, the number of options are more limited with Visium Spatial Gene Expression (co-detection of up to 8 proteins), Complete Genomics STOmics’ Transcriptomics mIF (with imaging and staining up to 3 antibodies) and Complete Genomics STOmics’ Stereo-CITE Proteo-Transcriptomics solution (co-detection of 100 proteins). This limitation is expected, as solid-phase capture methods often require tissue dissection and permeabilization, allowing mRNAs to diffuse to spatial barcodes. Complete Genomics STOmics’ Stereo-CITE Proteo-Transcriptomics is currently the only solution that combines whole-transcriptome profiling with spatial CITE-seq (though 10X Genomics hinted in an FAQ in 2021 that it’s developing a technique similar to CITE-seq to accompany the company’s Visium assay).
In contrast, Nanostring’s GeoMx offers whole-transcriptome profiling alongside detection of over 570 proteins. Its digital spatial profiling (DSP) approach uses light activation or oligo release for precise region-of-interest (ROI) selection. The non-destructive nature of light-based activation allows for sample reuse, enabling high-plex protein detection. However, GeoMx does not natively support single-cell transcriptomics; while ROIs can be as small as a single cell, only pooled transcriptomic data from the selected ROI is available.
Unlocking FFPE support
Advancing support for FFPEs is also crucial, as >1 billion legacy samples across biobanks and pharmaceutical companies are in this format today. It is worthwhile to check with every product offering that it supports this type of sample; sometimes,the requirement of FFPE compatibility can totally change the plexity, multi-omic capability that a commercial solution can offer.